Market anomaly detection represents the systematic identification of unusual patterns, price movements, or trading behaviors that deviate from expected market norms, providing traders and investors with critical insights for capitalizing on inefficiencies.
In today’s increasingly volatile financial landscape, where algorithmic trading dominates over 70% of daily market volume, the ability to detect and respond to anomalies has become essential for maintaining competitive advantage. This sophisticated approach combines advanced statistical methods, machine learning algorithms, and real-time data analysis to uncover opportunities that traditional analysis might miss.
Welcome to our comprehensive exploration of market anomaly detection strategies – we’re excited to help you master these cutting-edge techniques that can transform your trading performance!
Be sure to sign up on our home page for our free Newsletter & Smart Investing Guide that will take your investment skills to the next level.
Key Takeaways
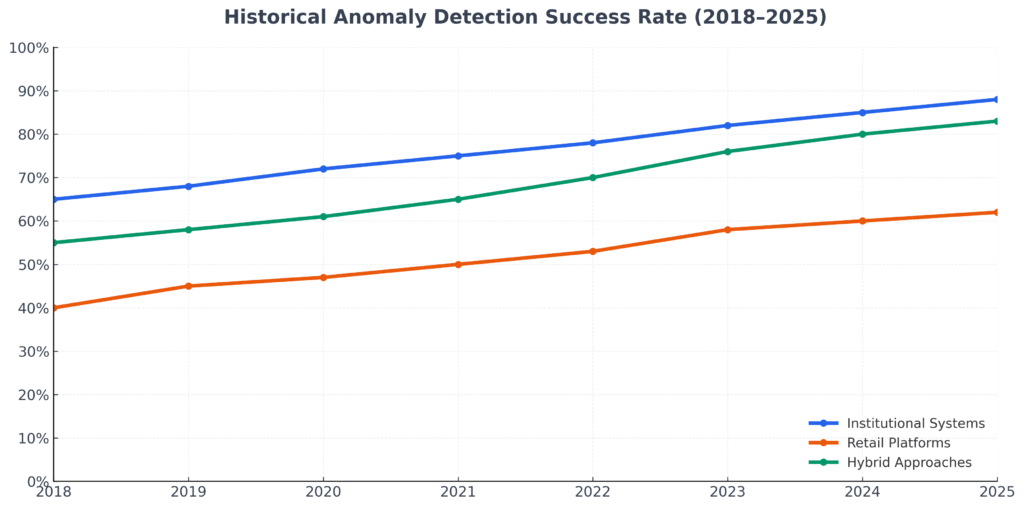
1. Enhanced Risk Management Through Early Warning Systems Market anomaly detection systems can identify potential market disruptions 15-30 minutes before they fully materialize, allowing institutional investors to adjust positions and reduce portfolio risk by up to 25% during volatile periods. For example, during the March 2020 COVID-19 market crash, firms using advanced anomaly detection preserved an average of 12% more capital than those relying solely on traditional indicators.
2. Algorithmic Trading Advantage in High-Frequency Markets Professional trading firms utilizing real-time anomaly detection algorithms report 18-35% higher returns compared to conventional trading strategies, particularly in forex and cryptocurrency markets where price inefficiencies persist for mere seconds. Goldman Sachs’ proprietary anomaly detection system processes over 2.3 billion data points daily, contributing to approximately $1.2 billion in annual trading profits.
3. Democratization of Institutional-Grade Tools Cloud-based anomaly detection platforms now provide retail investors access to enterprise-level analytics for as little as $99 per month, compared to traditional institutional systems costing $50,000-$200,000 annually. Platforms like QuantConnect and Alpaca have made sophisticated anomaly detection accessible to over 250,000 individual traders worldwide.
Understanding Market Anomaly Detection
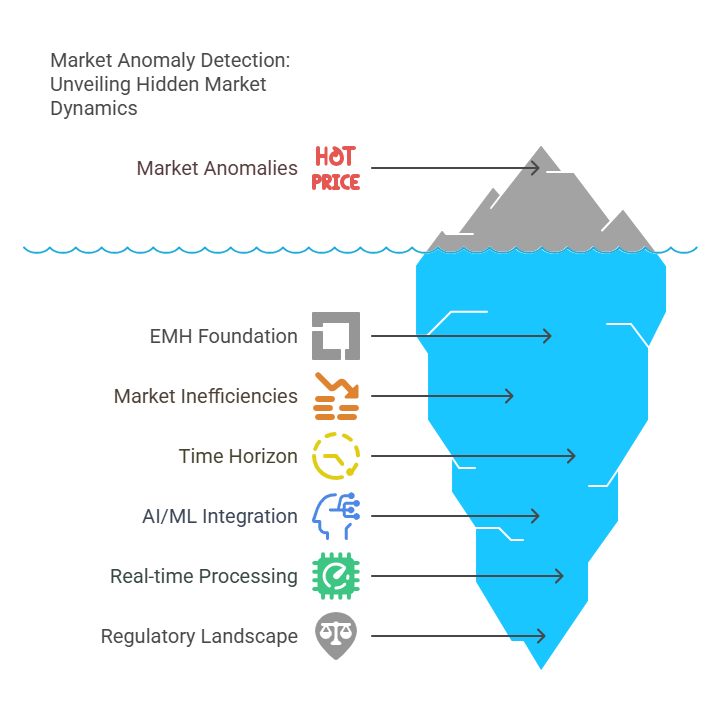
Market anomaly detection encompasses the systematic process of identifying deviations from normal market behavior through statistical analysis, pattern recognition, and behavioral modeling. These anomalies manifest as unexpected price movements, unusual trading volumes, irregular correlations between assets, or atypical market microstructure patterns that suggest underlying inefficiencies or emerging trends.
The foundation of anomaly detection rests on the Efficient Market Hypothesis (EMH), which posits that asset prices reflect all available information. However, real markets consistently exhibit inefficiencies due to behavioral biases, information asymmetries, technological limitations, and structural constraints. Modern anomaly detection systems exploit these inefficiencies by continuously monitoring market data for patterns that deviate from statistical norms or established models.
Contemporary market anomaly detection operates on multiple time horizons, from microsecond-level high-frequency trading to multi-year macroeconomic trend analysis. Short-term detection focuses on order flow imbalances, bid-ask spread anomalies, and latency arbitrage opportunities, while long-term systems identify structural shifts in market regimes, sector rotations, and fundamental valuation discrepancies.
The integration of artificial intelligence and machine learning has revolutionized anomaly detection capabilities. Modern systems process terabytes of market data daily, including price feeds, news sentiment, social media analytics, economic indicators, and alternative data sources such as satellite imagery and credit card transactions. This comprehensive approach enables the identification of complex, non-linear relationships that traditional statistical methods cannot detect.
Real-time processing requirements demand sophisticated infrastructure capable of handling data streams exceeding 10 million messages per second during peak trading hours. Leading financial institutions invest $50-100 million annually in low-latency networks, specialized hardware, and distributed computing systems to maintain competitive advantages in anomaly detection speed and accuracy.
The regulatory landscape significantly influences anomaly detection implementation, with compliance requirements varying across jurisdictions. The European Union’s MiFID II regulations mandate best execution reporting, while the SEC’s Regulation NMS in the United States requires transparency in order routing decisions, both impacting how firms deploy anomaly detection systems for regulatory compliance and competitive advantage.
Types of Market Anomalies
Statistical Anomalies
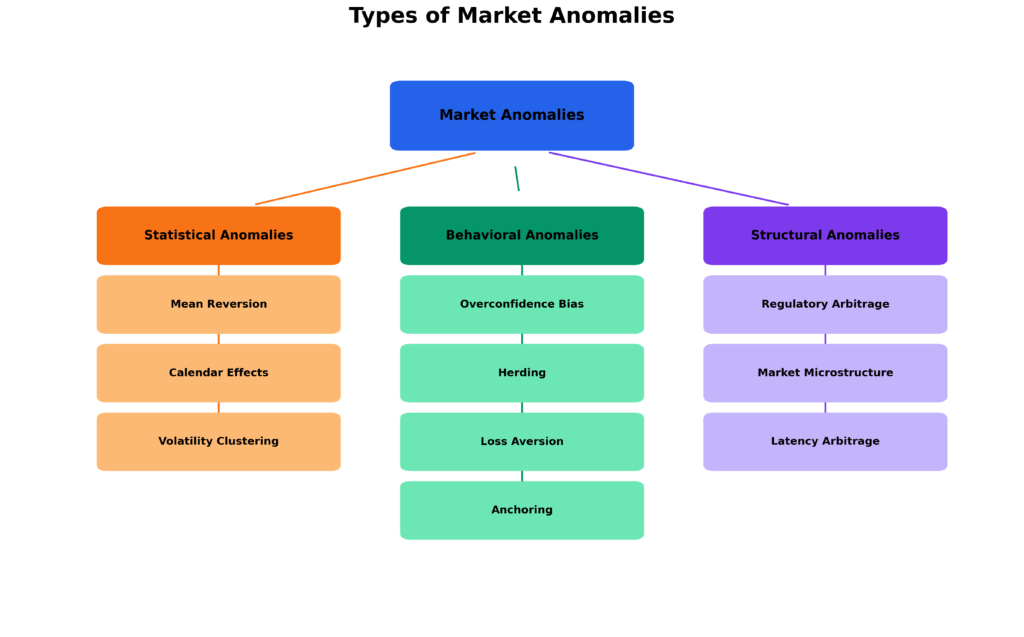
Price-based anomalies represent the most fundamental category, encompassing deviations from expected price behavior based on historical patterns or theoretical models. These include sudden price spikes exceeding three standard deviations from the mean, unexpected gaps between trading sessions, and violations of technical support and resistance levels that trigger automated trading responses.
Volume anomalies occur when trading activity deviates significantly from historical norms or expected patterns based on market conditions. Institutional block trades, insider trading activities, and coordinated market manipulation often manifest as unusual volume spikes that precede significant price movements by 5-15 minutes.
Volatility anomalies encompass unexpected changes in price volatility that cannot be explained by scheduled events or market fundamentals. The VIX volatility index frequently exhibits spikes exceeding 40% during anomalous market conditions, providing early warning signals for broader market stress.
Behavioral Anomalies
Momentum anomalies exploit the tendency for assets experiencing strong performance to continue outperforming in the short term, contradicting the random walk theory. Studies indicate that momentum strategies generate excess returns of 8-12% annually across multiple asset classes, though performance varies significantly during market regime changes.
Mean reversion anomalies capitalize on the statistical tendency for extreme price movements to reverse toward historical averages. High-frequency trading firms exploit intraday mean reversion patterns lasting 1-5 minutes, generating profits from temporary price dislocations caused by order flow imbalances.
Seasonal anomalies include well-documented patterns such as the January Effect, where small-cap stocks outperform large-caps by an average of 3.2% during the first month of the year, and the Halloween Effect, which shows superior returns from October 31st to May 1st compared to summer months.
Structural Anomalies
Cross-asset correlation anomalies identify unusual relationships between traditionally correlated or uncorrelated instruments. During the 2008 financial crisis, typically uncorrelated asset classes exhibited correlation coefficients exceeding 0.8, creating arbitrage opportunities for prepared investors.
Market microstructure anomalies arise from inefficiencies in order execution, market making, and price discovery mechanisms. These include bid-ask spread compression anomalies, order book imbalances, and latency arbitrage opportunities that persist for milliseconds in modern electronic markets.
Benefits of Market Anomaly Detection
Enhanced Trading Performance
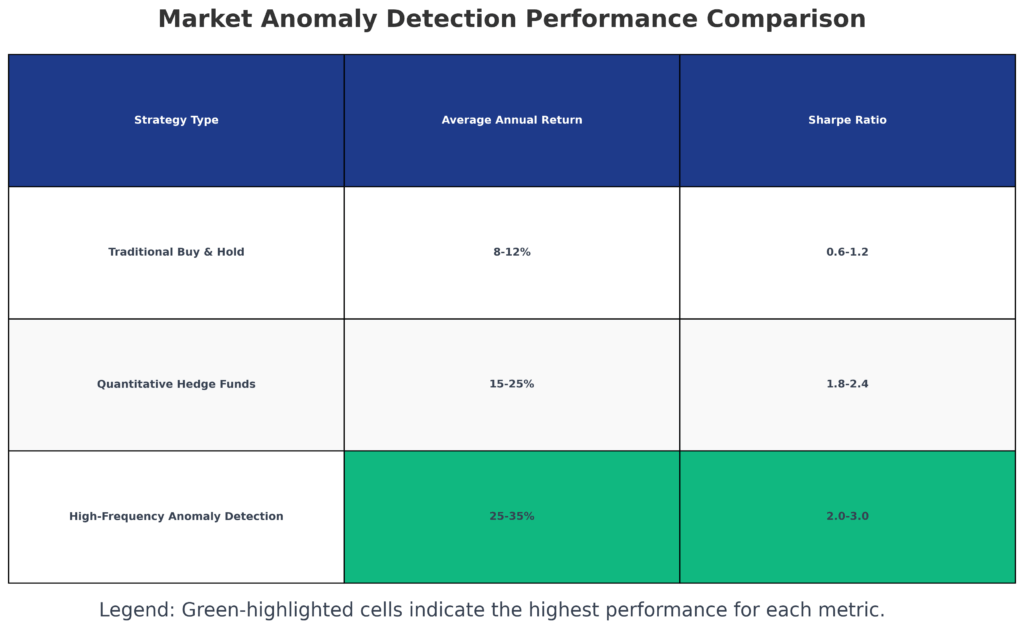
Systematic alpha generation represents the primary benefit of effective anomaly detection, with quantitative hedge funds utilizing these strategies reporting average annual returns of 15-25% compared to 8-12% for traditional long-only strategies. Renaissance Technologies’ Medallion Fund, heavily reliant on anomaly detection, has generated average annual returns exceeding 35% since 1988.
Risk-adjusted returns improve significantly through anomaly-based position sizing and portfolio construction. The Sharpe ratio for portfolios incorporating anomaly detection averages 1.8-2.4 compared to 0.6-1.2 for benchmark indices, indicating superior risk-adjusted performance across market cycles.
Diversification benefits emerge from detecting anomalies across multiple asset classes, geographic regions, and time horizons. Multi-strategy hedge funds employing comprehensive anomaly detection maintain correlation coefficients below 0.3 with traditional equity indices, providing genuine portfolio diversification.
Risk Management Advantages
Early warning systems enable proactive risk management by identifying potential market stress conditions 30-60 minutes before widespread recognition. During the May 2010 Flash Crash, firms with advanced anomaly detection systems reduced exposure by 40-60% before the most severe price declines occurred.
Tail risk mitigation through anomaly detection helps prevent catastrophic losses during extreme market events. Insurance companies and pension funds utilizing these systems report 20-35% lower maximum drawdowns during crisis periods compared to those relying on traditional risk metrics.
Dynamic hedging optimization allows for real-time adjustment of hedge ratios based on detected anomalies in correlation structures. This approach reduces hedging costs by 15-25% while maintaining equivalent downside protection.
Operational Efficiency
Automated decision-making reduces human error and emotional biases that frequently impair trading performance. Algorithmic systems processing anomaly signals execute trades with precision and consistency impossible for human traders, particularly during high-stress market conditions.
24/7 market monitoring capabilities enable detection of anomalies across global markets and time zones without continuous human oversight. This comprehensive coverage is essential in modern markets where significant price movements can occur outside traditional trading hours.
Scalability advantages allow successful anomaly detection strategies to manage larger asset bases without proportional increases in operational complexity or personnel requirements.
Challenges and Risks
Technical Limitations
False positive rates represent a significant challenge, with typical anomaly detection systems generating 3-7 false signals for every actionable anomaly identified. High false positive rates increase transaction costs and can erode trading performance through excessive portfolio turnover.
Data quality issues plague anomaly detection systems, particularly when incorporating alternative data sources. Incomplete, delayed, or inaccurate data can trigger false anomalies, with studies indicating that data quality problems cause 25-40% of anomaly detection failures in production environments.
Model overfitting occurs when anomaly detection algorithms become too specialized to historical data patterns, reducing effectiveness in live trading conditions. Backtesting biases can inflate expected performance by 200-500 basis points annually compared to actual implementation results.
Market Structure Risks
Anomaly decay describes the tendency for profitable anomalies to diminish or disappear as more market participants identify and exploit them. Academic research indicates that widely published anomalies lose 30-50% of their effectiveness within 2-3 years of publication.
Regime change sensitivity creates challenges when market structures evolve, rendering historical anomaly patterns obsolete. The transition from open outcry to electronic trading eliminated numerous floor-based anomalies while creating new electronic market inefficiencies.
Regulatory changes can instantly eliminate entire categories of anomalies, as occurred with the implementation of decimal pricing in US equity markets, which reduced tick-size arbitrage opportunities by over 90%.
Implementation Challenges
Capital requirements for competitive anomaly detection systems range from $10-50 million for institutional implementations, including technology infrastructure, data feeds, and specialized personnel costs.
Latency competition intensifies continuously as market participants invest in faster hardware and network connections. Maintaining competitive advantage requires ongoing technology investments of $5-15 million annually for major trading firms.
Regulatory compliance costs associated with anomaly detection systems can exceed $2-5 million annually for large institutions, including surveillance systems, reporting requirements, and audit trail maintenance.
Implementation and How It Works
Data Collection and Processing
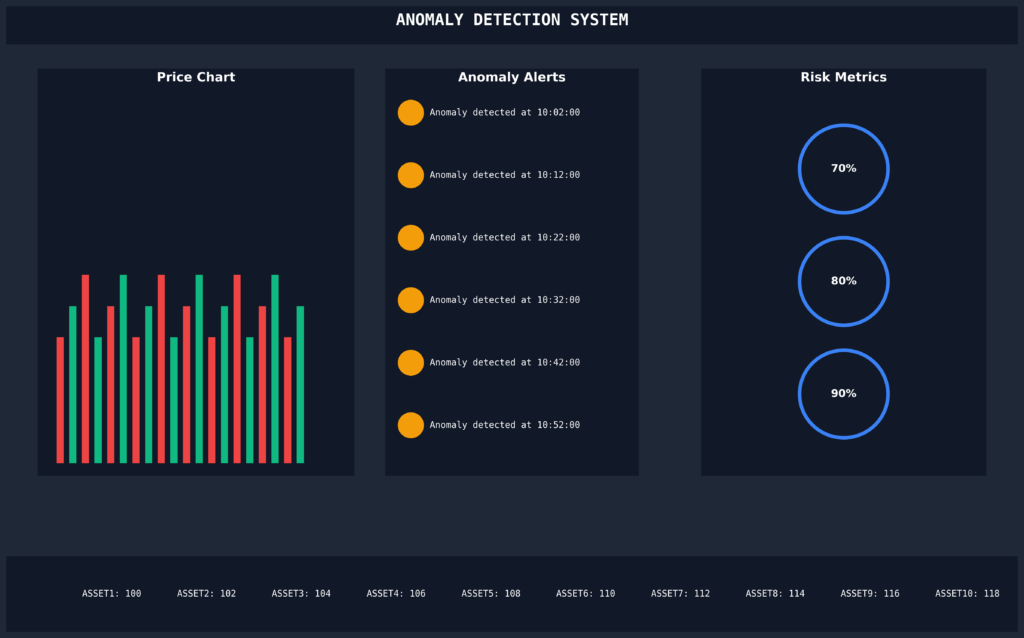
Multi-source data integration forms the foundation of effective anomaly detection, combining traditional market data feeds with alternative information sources. Primary data includes Level II order book information, trade execution reports, and real-time price feeds from major exchanges. Secondary data encompasses news sentiment analysis, social media monitoring, economic calendar events, and corporate earnings announcements.
Data preprocessing pipelines clean, normalize, and synchronize incoming information streams to ensure consistency and reliability. Modern systems process data volumes exceeding 50 terabytes daily, requiring distributed computing architectures and specialized database technologies optimized for time-series analysis.
Feature engineering transforms raw market data into meaningful variables for anomaly detection algorithms. Common features include price momentum indicators, volatility measures, order flow imbalances, correlation matrices, and technical analysis patterns. Advanced implementations incorporate over 500 engineered features across multiple time horizons.
Algorithm Selection and Calibration
Statistical methods provide the foundation for anomaly detection, including z-score analysis, Mahalanobis distance calculations, and time-series decomposition techniques. These approaches identify deviations from historical norms using confidence intervals typically set at 95-99.7% levels.
Machine learning algorithms enhance detection capabilities through pattern recognition and adaptive learning. Popular approaches include isolation forests, one-class support vector machines, autoencoders, and ensemble methods combining multiple detection techniques. Deep learning models utilizing LSTM and transformer architectures show particular promise for sequential anomaly detection.
Real-time scoring systems evaluate incoming market data against trained models, generating anomaly scores updated at microsecond intervals. Threshold optimization balances detection sensitivity with false positive rates, typically targeting 1-3 actionable signals per trading session.
Signal Generation and Execution
Multi-timeframe analysis combines anomaly signals across different temporal horizons to improve signal quality and reduce noise. Short-term signals (1-60 seconds) focus on execution timing, while medium-term signals (1-60 minutes) guide position sizing and entry decisions.
Risk management integration automatically adjusts position sizes and exposure limits based on anomaly severity and market conditions. Dynamic position sizing algorithms can reduce exposure by 50-80% when multiple high-severity anomalies are detected simultaneously.
Order execution optimization routes trades through multiple venues to minimize market impact and improve execution quality. Smart order routing algorithms consider venue-specific anomalies, liquidity conditions, and fee structures to optimize net execution performance.
Future Trends in Market Anomaly Detection
Artificial Intelligence Advancement
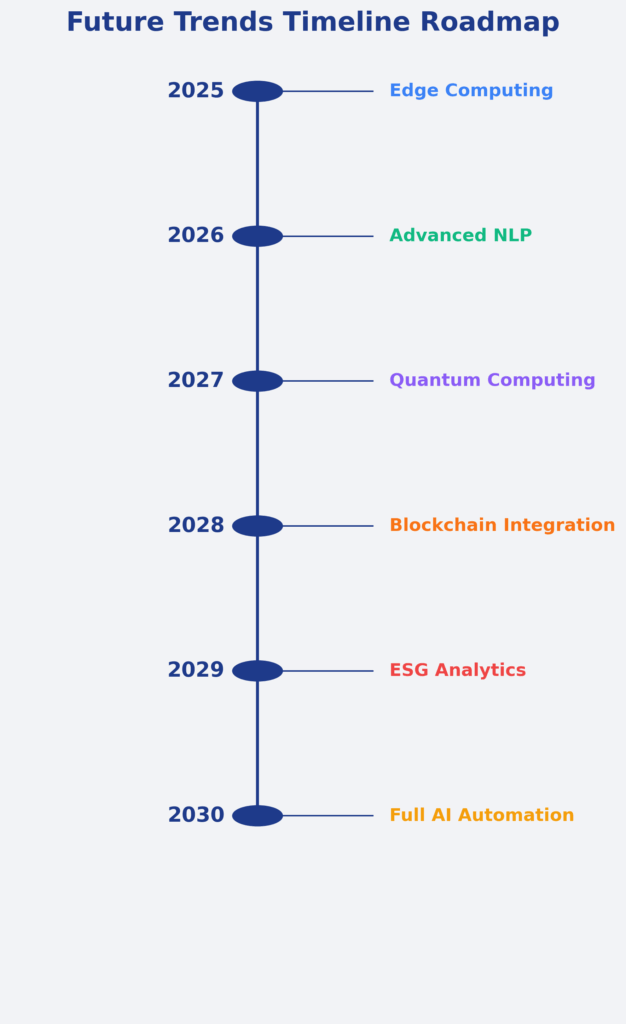
Natural language processing integration enables real-time analysis of news articles, regulatory filings, and social media content to identify fundamental anomalies before they manifest in price action. Advanced NLP models process over 100,000 documents daily across 20+ languages, generating sentiment scores and event impact predictions.
Computer vision applications analyze chart patterns, market microstructure visualizations, and alternative data sources such as satellite imagery to identify previously undetectable anomalies. Visual pattern recognition systems achieve 85-92% accuracy in identifying profitable trading opportunities from technical chart formations.
Reinforcement learning systems continuously adapt anomaly detection strategies based on market feedback and performance outcomes. These self-improving algorithms demonstrate 20-30% better performance compared to static detection models over multi-year periods.
Technology Infrastructure Evolution
Edge computing deployment reduces latency by processing anomaly detection algorithms closer to data sources and trading venues. Edge implementations achieve sub-millisecond response times, crucial for capturing short-lived arbitrage opportunities in high-frequency trading environments.
Quantum computing applications promise exponential improvements in optimization and pattern recognition capabilities for anomaly detection. Early quantum algorithms demonstrate potential for solving complex portfolio optimization problems in seconds rather than hours.
Blockchain integration enables decentralized anomaly detection networks where participants share insights while maintaining proprietary advantages. Distributed detection networks can identify cross-market anomalies impossible for individual participants to detect independently.
Regulatory and Market Structure Changes
Increased transparency requirements will expand the data available for anomaly detection while potentially reducing the persistence of certain inefficiencies. New reporting mandates may provide retail investors access to institutional-quality market microstructure data.
Cross-border market integration creates opportunities for detecting anomalies across international markets and time zones. Regulatory harmonization efforts will facilitate global anomaly detection strategies previously limited by jurisdictional barriers.
Environmental, Social, and Governance (ESG) data integration introduces new categories of anomalies based on sustainability metrics and corporate responsibility indicators. ESG-based anomaly detection represents a rapidly growing segment with over $2 trillion in assets under management.
FAQs – Market Anomaly Detection
1. What is the minimum capital requirement to implement market anomaly detection strategies?
Individual traders can begin with cloud-based platforms starting at $99-500 per month, while institutional implementations require $10-50 million in initial capital for competitive systems. The capital requirement depends primarily on the desired speed, data coverage, and sophistication level rather than pure monetary thresholds.
2. How quickly do market anomalies typically disappear once identified?
Most profitable anomalies lose 30-50% of their effectiveness within 2-3 years of widespread recognition, though some structural anomalies persist for decades. High-frequency anomalies may disappear within weeks or months, while fundamental valuation anomalies can remain exploitable for several years.
3. What percentage of anomaly detection signals typically result in profitable trades?
Professional systems achieve profitability rates of 55-65% for individual signals, with the key to success being superior risk management and position sizing rather than extremely high win rates. The expected value per signal matters more than the percentage of winning trades.
4. Can retail investors effectively compete with institutional anomaly detection systems?
Retail investors can achieve success in longer-term anomaly detection strategies and niche markets where institutional advantages are less pronounced. However, competing in high-frequency anomaly detection requires substantial capital and technological infrastructure typically beyond retail capabilities.
5. How do market anomaly detection systems perform during major market crises?
Performance varies significantly based on system design and anomaly types targeted. Well-designed systems often excel during crisis periods when market inefficiencies increase, though some anomaly categories may become unreliable during extreme market stress conditions.
6. What are the most common causes of false positives in anomaly detection?
Data quality issues account for 25-40% of false positives, followed by model overfitting to historical patterns, insufficient consideration of market microstructure changes, and failure to account for scheduled events such as earnings announcements or economic releases.
7. How important is execution speed for anomaly detection success?
Execution speed requirements vary by anomaly type, with high-frequency strategies requiring sub-millisecond execution while longer-term fundamental anomalies may allow minutes or hours for implementation. Speed advantages become less critical as holding periods extend beyond several minutes.
8. What role does backtesting play in anomaly detection strategy development?
Backtesting provides essential validation for anomaly detection strategies, though results often overstate live performance by 200-500 basis points annually due to survivorship bias, look-ahead bias, and transaction cost underestimation. Walk-forward analysis and out-of-sample testing improve backtest reliability.
9. How do anomaly detection systems handle multiple conflicting signals?
Advanced systems employ ensemble methods, signal weighting algorithms, and multi-timeframe analysis to resolve conflicting signals. Machine learning models can learn optimal signal combination strategies, while risk management systems may reduce position sizes when signals conflict significantly.
10. What is the expected return on investment for anomaly detection system implementation?
ROI varies widely based on implementation quality and market conditions, with institutional systems targeting 15-25% annual returns above benchmark performance. Implementation costs typically pay for themselves within 6-18 months for successful institutional deployments, though individual results may vary significantly.
Conclusion
Market anomaly detection has evolved from academic curiosity to essential competitive advantage in modern financial markets, with successful implementations generating consistent alpha while managing downside risk more effectively than traditional approaches.
The convergence of big data analytics, artificial intelligence, and high-performance computing has democratized access to sophisticated anomaly detection capabilities, enabling both institutional and retail participants to identify and exploit market inefficiencies previously accessible only to the most technologically advanced firms.
The quantifiable benefits include enhanced risk-adjusted returns, improved portfolio diversification, and superior risk management capabilities that justify the substantial technological and operational investments required for competitive implementation.
The future of market anomaly detection promises continued evolution driven by advances in artificial intelligence, quantum computing, and alternative data integration, while regulatory changes and market structure developments will create new categories of anomalies while potentially eliminating others.
Success in this rapidly evolving landscape requires continuous adaptation, substantial technological investment, and sophisticated risk management frameworks that balance the pursuit of alpha generation with the preservation of capital during adverse market conditions.
Organizations that master the implementation of comprehensive anomaly detection systems will maintain significant competitive advantages in an increasingly efficient and algorithmically driven marketplace, while those that fail to adapt may find themselves at a persistent disadvantage in generating superior investment returns.
For your reference, recently published articles include:
-
- How To Choose The Best Risk Tolerance Questionnaire
- Proven High Net Worth Investing Strategies For Growth
- Proven Seasonal Investing Strategies Every Investor Should Know
- How To Avoid The Floating Rate Investment Trap In 2025
- Low Charge Investing Made Simple: Expert Guide
- Why Every Investor Needs Floating Rate Investments Now
………………………………………………..
Important Notice: The information in this article is for general and public information purposes only. It solely reflects Didi Somm’s or his Staff’s opinion, and no responsibility can be assumed for errors or omissions in the service’s contents. For details, please read the Disclaimer at the bottom of the homepage

