In today’s complex financial landscape, the difference between average and exceptional investment returns often lies in how effectively investors measure and analyze their portfolio performance.
Professional investors rely on sophisticated metrics that go far beyond simple returns to make informed decisions, manage risk, and consistently outperform the market.
This comprehensive guide explores the essential investment performance metrics that drive successful investment strategies and help create sustainable wealth.
Key Takeaways
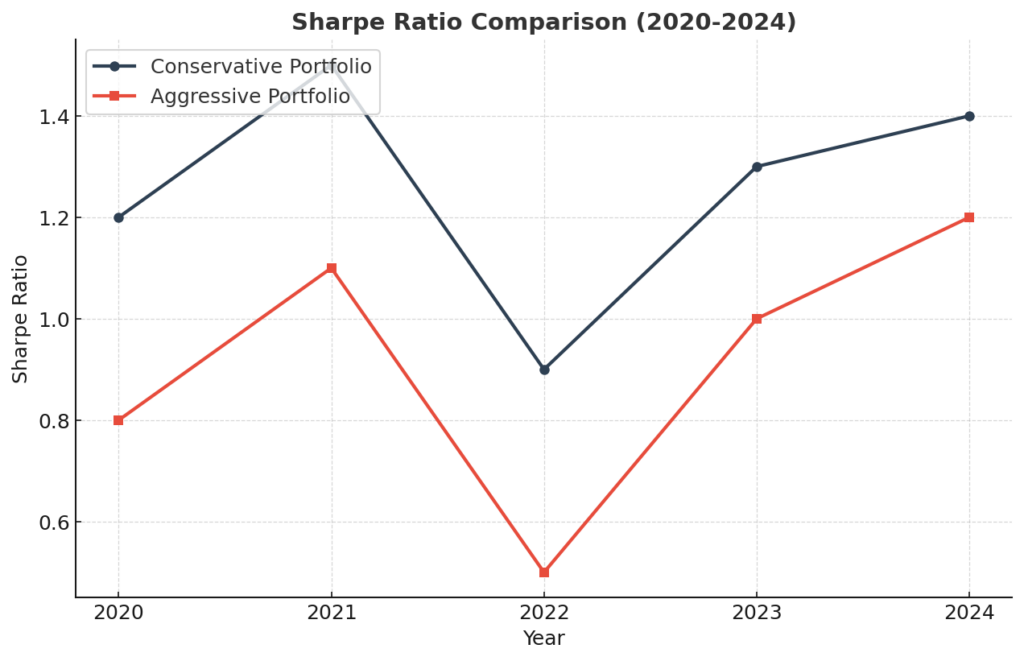
- Risk-Adjusted Return Metrics, particularly the Sharpe Ratio and Sortino Ratio, provide a more complete picture of investment performance than raw returns alone. For example, a portfolio generating 15% annual returns with a Sharpe Ratio of 1.8 demonstrates superior risk management compared to one with 20% returns but a Sharpe Ratio of 0.9, as evidenced by its more consistent performance during market downturns and lower volatility.
- Modern Portfolio Analysis requires a combination of absolute and relative performance metrics to optimize investment decisions. Professional investors typically track at least five core metrics: alpha, beta, R-squared, standard deviation, and maximum drawdown. A practical application is seen in hedge funds that consistently generate alpha of 3-5% while maintaining beta below 0.8, demonstrating their ability to create value regardless of market conditions.
- Implementation of Sophisticated Performance Metrics has become increasingly accessible through advanced financial technology platforms. Today’s investors can leverage tools that automatically calculate complex metrics like Jensen’s Alpha and Information Ratio, with leading platforms offering real-time analysis for portfolios of any size. This democratization of professional-grade analytics has leveled the playing field for individual investors.
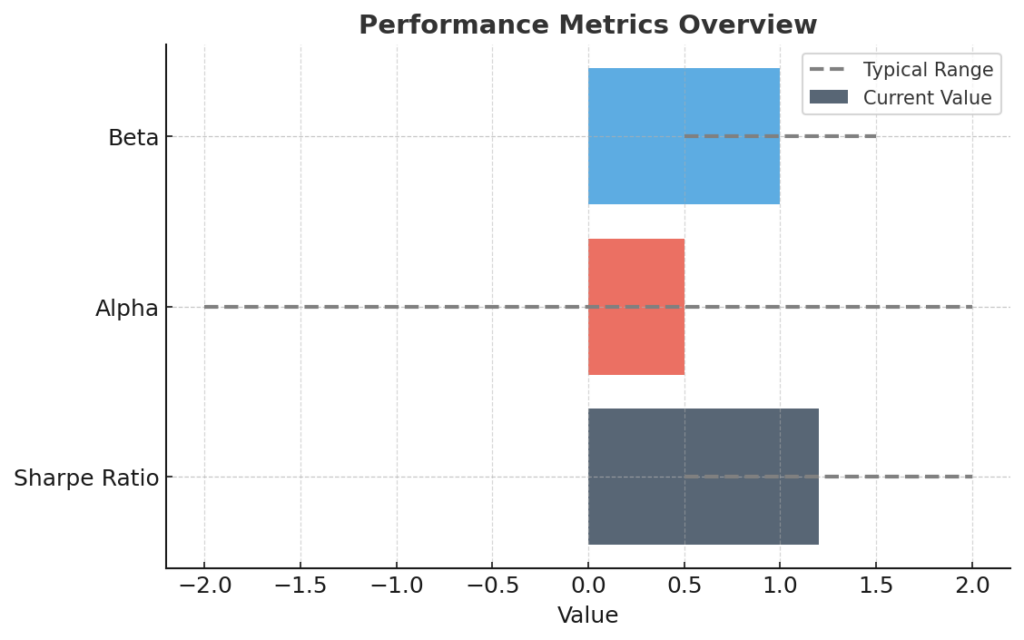
Table of Contents
Understanding Investment Performance Metrics
Investment performance metrics serve as the foundation for making informed investment decisions and evaluating the effectiveness of investment strategies. These quantitative measures help investors understand not just how much money they’re making or losing, but also the quality and sustainability of their returns relative to the risks taken.
The evolution of performance metrics has transformed from simple measures of return to sophisticated analytical tools that account for risk, market conditions, and behavioral factors. Modern portfolio theory, developed by Harry Markowitz in 1952, laid the groundwork for many of today’s most important metrics by introducing the concept of risk-adjusted returns.
In today’s market, professional investors rely on a comprehensive suite of metrics that provide insights into different aspects of portfolio performance, from risk-adjusted returns to benchmark comparison and risk attribution. These metrics work together to create a complete picture of investment performance that guides decision-making and strategy development.
Types of Performance Metrics
Risk-Adjusted Return Metrics
Risk-adjusted return metrics form the cornerstone of modern portfolio analysis by measuring how much excess return is generated for each unit of risk taken. These metrics include:
- Sharpe Ratio: Measures excess return per unit of total risk, with higher values indicating better risk-adjusted performance
- Sortino Ratio: Similar to Sharpe but focuses only on downside risk
- Treynor Ratio: Evaluates excess return per unit of systematic risk
- Information Ratio: Assesses active management skill through consistency of alpha generation
Absolute Return Metrics
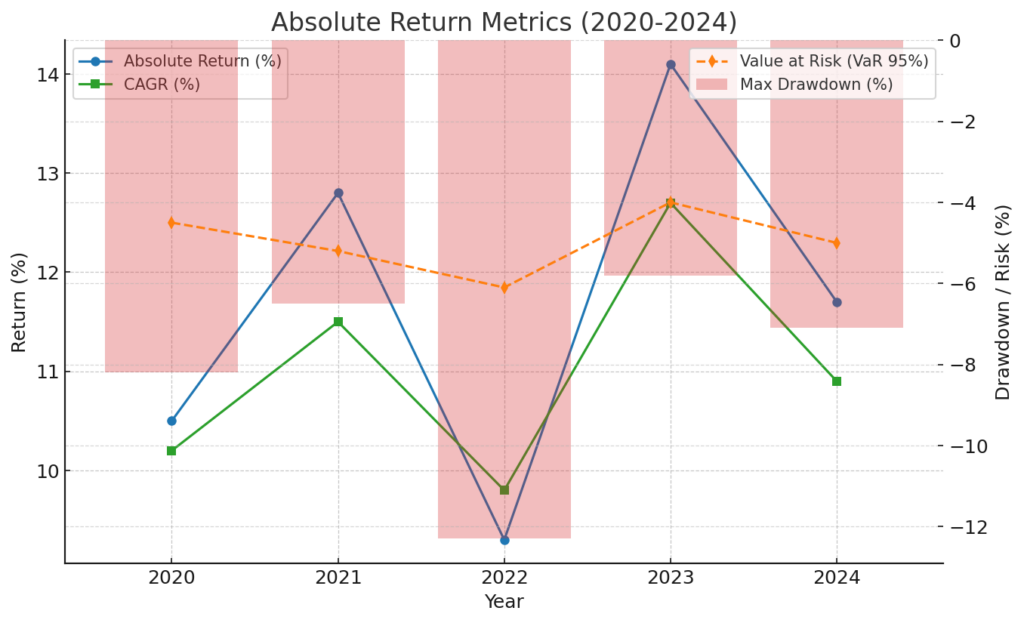
These metrics measure performance without reference to any benchmark:
- Absolute Return: Simple percentage gain or loss over a period
- Maximum Drawdown: Largest peak-to-trough decline
- Value at Risk (VaR): Potential loss within a specific confidence interval
- Compound Annual Growth Rate (CAGR): Smoothed annualized return
Relative Performance Metrics
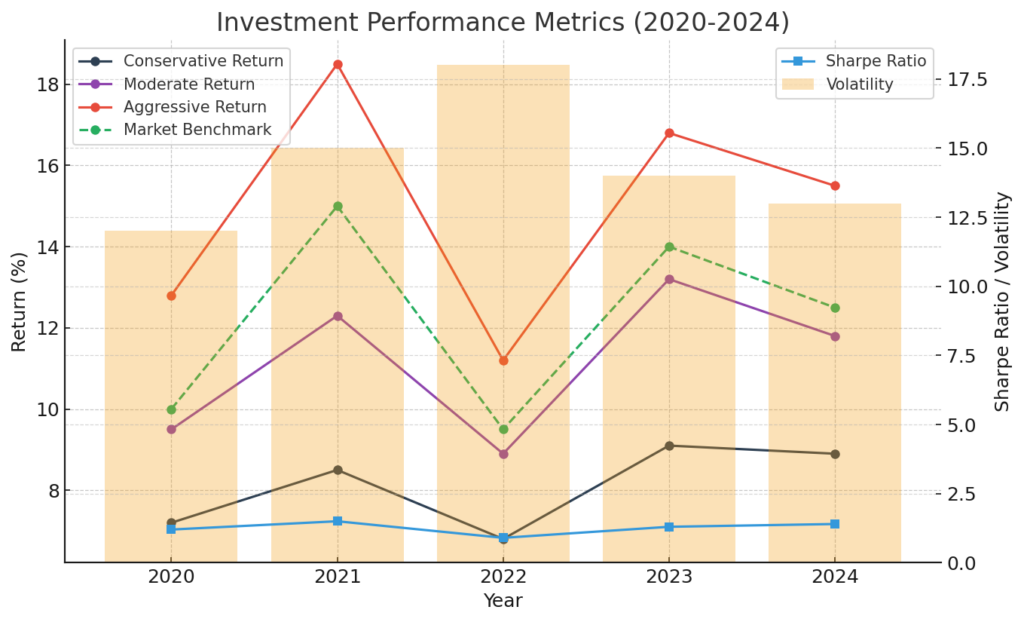
Relative metrics compare portfolio performance to appropriate benchmarks:
- Alpha: Excess return compared to expected return based on risk
- Beta: Sensitivity to market movements
- R-squared: Degree of movement explained by benchmark
- Tracking Error: Consistency of excess returns
Benefits of Using Professional Performance Metrics
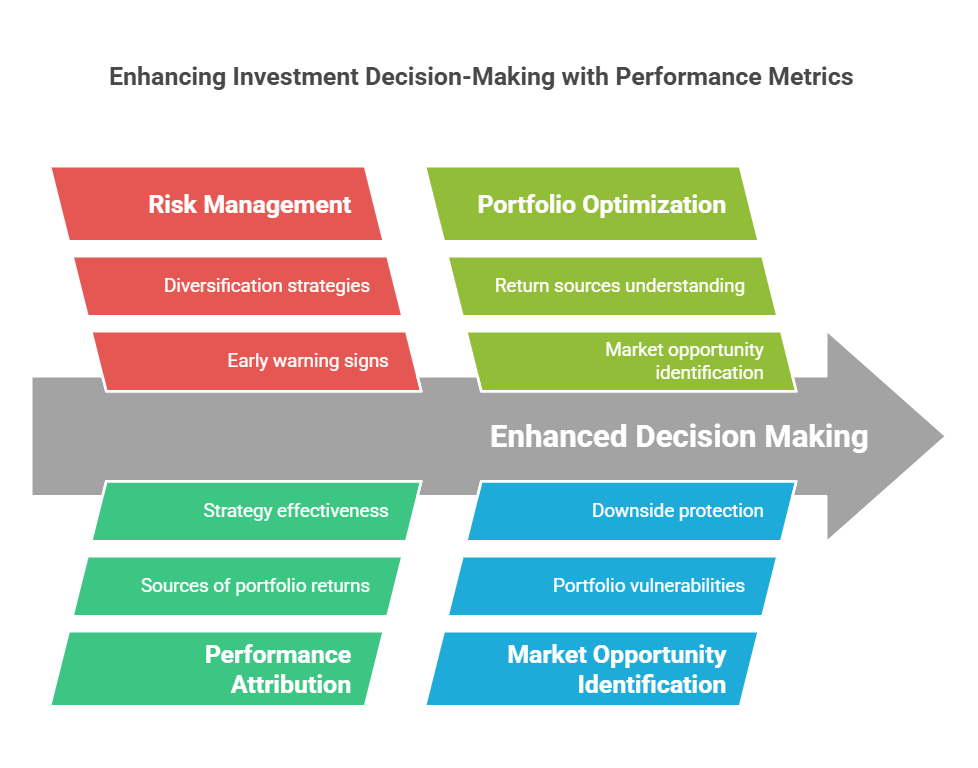
Enhanced Decision Making
Professional performance metrics provide several advantages for investment decision-making:
- More accurate risk assessment through multiple perspectives
- Better understanding of return sources
- Improved portfolio optimization capabilities
- Enhanced ability to identify market opportunities
Risk Management
Sophisticated metrics enable better risk management through:
- Early warning signs of potential problems
- Better understanding of portfolio vulnerabilities
- More effective diversification strategies
- Improved downside protection
Performance Attribution
These metrics help investors understand:
- Sources of portfolio returns
- Effectiveness of different strategies
- Impact of various investment decisions
- Areas needing improvement
Challenges and Risks
Data Requirements
Implementing professional performance metrics requires:
- High-quality, consistent data
- Regular updates and maintenance
- Proper data cleaning and validation
- Significant computational resources
Interpretation Complexity
Challenges in using these metrics include:
- Need for statistical knowledge
- Potential for misinterpretation
- Complex interactions between metrics
- Time period sensitivity
Implementation Issues
Common implementation challenges:
- Cost of sophisticated analysis tools
- Integration with existing systems
- Training requirements
- Resource allocation
Implementation Guide
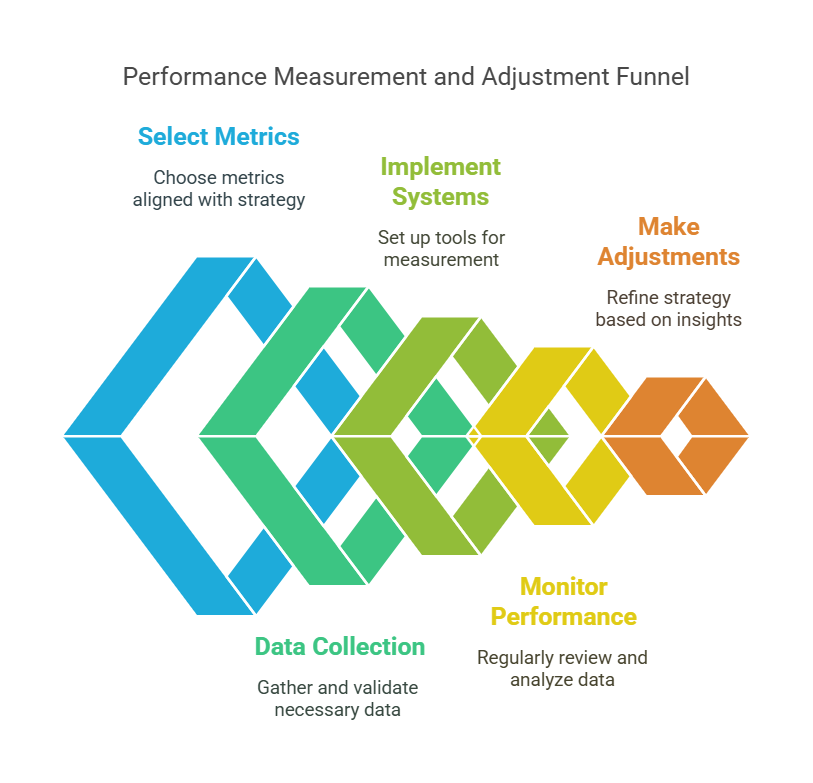
Setting Up Performance Measurement
- Define investment objectives and constraints
- Select appropriate metrics based on strategy
- Establish data collection and validation processes
- Implement measurement systems and tools
Monitoring and Analysis
- Regular performance review schedule
- Threshold setting for different metrics
- Documentation of analysis and decisions
- Regular system updates and maintenance
Making Adjustments
- Process for incorporating metric insights
- Regular strategy review and adjustment
- Performance attribution analysis
- Continuous improvement framework
Future Trends
Technology Integration
The future of performance metrics includes:
- Artificial Intelligence and Machine Learning applications
- Real-time analysis capabilities
- Automated adjustment recommendations
- Enhanced visualization tools
Enhanced Analytics
Emerging analytical capabilities:
- Alternative data integration
- Environmental, Social, and Governance (ESG) metrics
- Behavioral analytics
- Predictive performance measures
FAQs – Investment Performance Metrics
1. What is the most important performance metric for long-term investors?
The Sharpe Ratio remains one of the most important metrics for long-term investors as it provides a standardized measure of risk-adjusted returns. It helps investors understand if they’re being adequately compensated for the risk they’re taking.
2. How often should investment performance metrics be calculated and reviewed?
Professional investors typically calculate and review core metrics monthly, with more comprehensive analysis performed quarterly. However, certain metrics like Value at Risk (VaR) may be monitored daily for risk management purposes.
3. Can investment performance metrics predict future returns?
While performance metrics cannot directly predict future returns, they can provide valuable insights into the quality and sustainability of investment strategies, helping investors make more informed decisions about future investments.
4. What’s the minimum portfolio size for implementing professional metrics?
There is no minimum portfolio size for implementing professional metrics. However, the cost-benefit analysis of sophisticated analysis tools becomes more favorable with larger portfolios, typically above $100,000.
5. How do performance metrics account for different market conditions?
Many metrics incorporate market condition adjustments through various statistical methods. For example, the Information Ratio considers market volatility, while Jensen’s Alpha accounts for different market environments through beta adjustment.
6. What software tools are recommended for calculating investment performance metrics?
Professional-grade tools like Bloomberg Terminal, FactSet, and Morningstar Direct are industry standards. For individual investors, platforms like Portfolio Visualizer and YCharts offer good alternatives.
7. How do fees impact investment performance metrics?
Fees directly impact performance metrics by reducing returns. Most professional metrics are calculated on a net-of-fees basis to provide a more accurate picture of actual investment performance.
8. What are the limitations of investment performance metrics?
Performance metrics have limitations including reliance on historical data, assumptions about return distributions, and sensitivity to time periods chosen. They should be used as tools rather than absolute indicators.
9. How do different investment styles affect metric selection?
Investment styles significantly influence metric selection. For example, absolute return strategies might focus on Sortino Ratio and Maximum Drawdown, while relative return strategies might emphasize Information Ratio and Tracking Error.
10. What is the role of benchmarks in performance measurement?
Benchmarks provide context for performance evaluation and are essential for calculating relative metrics like Alpha and Information Ratio. Choosing appropriate benchmarks is crucial for meaningful performance measurement.
Conclusion
Professional performance metrics have become essential tools for successful investing in today’s complex markets. By providing detailed insights into risk-adjusted returns, portfolio efficiency, and strategy effectiveness, these metrics enable investors to make more informed decisions and achieve better outcomes. The growing accessibility of sophisticated analytical tools has democratized professional-grade portfolio analysis, allowing investors of all sizes to benefit from these advanced techniques.
Looking ahead, the integration of artificial intelligence, alternative data, and enhanced analytical capabilities will further evolve the landscape of performance measurement. Successful investors will need to stay current with these developments while maintaining a solid understanding of fundamental metrics that have proven their value over time.
As markets continue to evolve, the ability to effectively use and interpret performance metrics will remain a key differentiator between average and exceptional investment results.
For your reference, recently published articles include:
- Portfolio Stress Testing: Best Advice For Resilient And Profitable Investing
- Outperform 90% Of Investors: Best Advice On Investment Benchmarking Tools
- Trading Fee Comparison: Your 2025 Guide to Commission-Free Platforms
- Investment Tax Optimization: The Ultimate Guide To Save Legally
- Retire 10 Years Earlier: Revolutionary Financial Goal Planning Strategies
………………………………………………..
Important Notice: The information in this article is for general and public information purposes only. It solely reflects Didi Somm’s or his Staff’s opinion, and no responsibility can be assumed for errors or omissions in the service’s contents. For details, please check the Disclaimer at the bottom of the homepage.

