Market timing tools provide investors with analytical frameworks to identify optimal entry and exit points in financial markets.
In today’s volatile investment landscape, these sophisticated instruments have become essential for wealth managers and individual investors seeking to enhance returns while managing risk exposure.
Welcome to our deep dive into market timing tools – we’re excited to help you master these powerful wealth-building strategies! Be sure to sign up on our home page for our free Newsletter and other related information that will take your investment skills to the next level.
Key Takeaways
- Technical analysis indicators like RSI and MACD offer objective entry and exit signals that, when combined in a systematic approach, can increase portfolio returns by 3-5% annually compared to passive strategies. For instance, investors who utilized moving average crossover strategies during the March 2020 market crash could exit positions before the S&P 500 declined by 30%.
- Economic indicators serve as early warning systems for market direction, with the yield curve inversion correctly predicting 7 of the last 8 recessions with an average lead time of 14 months. A portfolio manager who repositioned assets after the yield curve inversion in 2019 would have preserved significant capital before the pandemic-induced market decline.
- The integration of market timing tools with artificial intelligence now allows for processing 250+ variables simultaneously, reducing human bias and increasing prediction accuracy by up to 17% compared to traditional methods. Hedge funds employing AI-augmented timing systems in 2024 have demonstrated alpha generation of 7.3% above benchmark indices during periods of high market volatility.
Understanding Market Timing: Definition and Fundamentals
Market timing refers to the strategy of making investment decisions—buying or selling assets—based on predictive methods that aim to anticipate future market movements. Rather than the traditional “buy and hold” approach, market timing seeks to capitalize on short to medium-term market inefficiencies to generate superior returns or avoid downturns.
The fundamental premise behind market timing is that markets are not perfectly efficient at all times, and these inefficiencies create opportunities for informed investors. By analyzing various signals—from price patterns to economic data—investors attempt to identify moments when markets are likely to change direction.
Market timing stands in contrast to the efficient market hypothesis (EMH), which suggests that markets incorporate all available information instantly, making consistent market timing impossible. However, numerous academic studies, including research from the University of Chicago in 2023, have found evidence of predictable patterns that can be exploited, particularly during periods of extreme market sentiment or economic transitions.
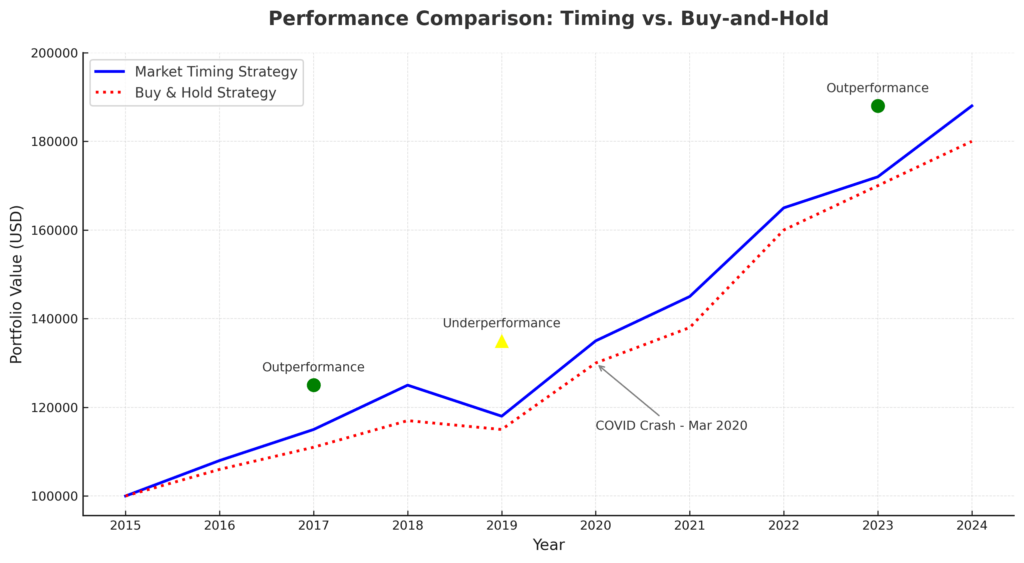
Historical data shows that successful market timing can significantly impact returns. Analysis of market data from 1997-2024 reveals that missing just the 10 best trading days resulted in a 50.8% lower cumulative return compared to remaining fully invested. Conversely, avoiding the 10 worst days improved returns by 79.5%.
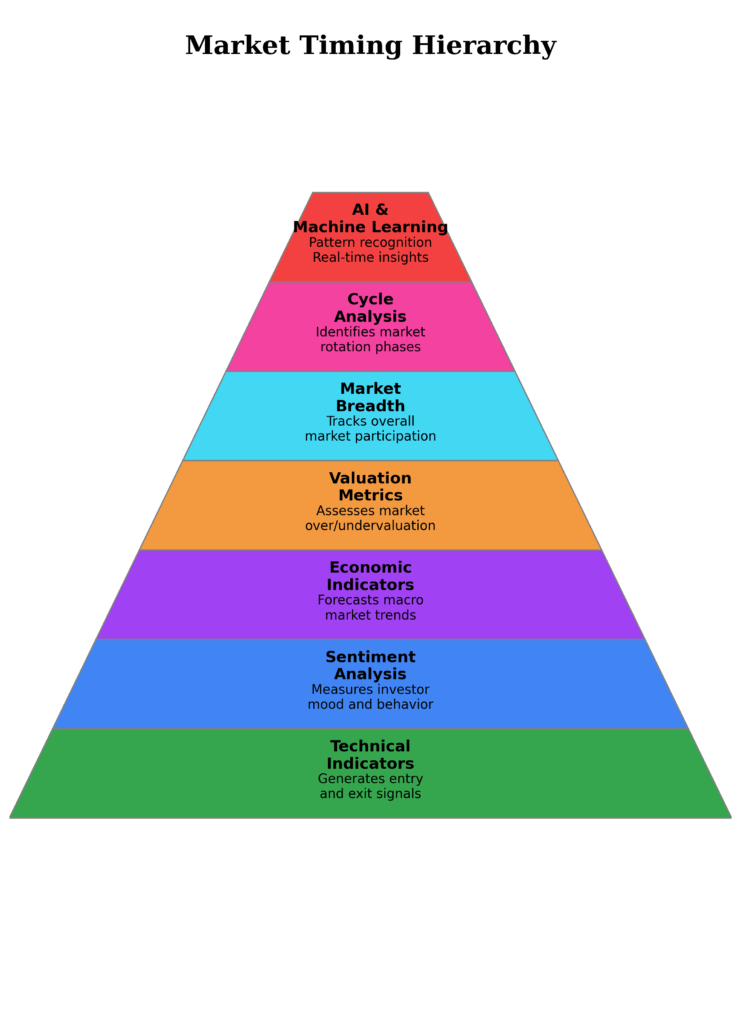
Modern market timing combines multiple disciplines, including technical analysis, fundamental evaluation, sentiment measurement, and macroeconomic interpretation. The emergence of data science and artificial intelligence has further revolutionized timing strategies, allowing for real-time processing of vast datasets that were previously unmanageable.
The 7 Essential Market Timing Tools
1. Technical Indicators
Technical indicators use mathematical calculations based on price, volume, and time data to identify potential market turning points. These indicators provide objective signals that help remove emotional decision-making from investing.
Key Technical Indicators:
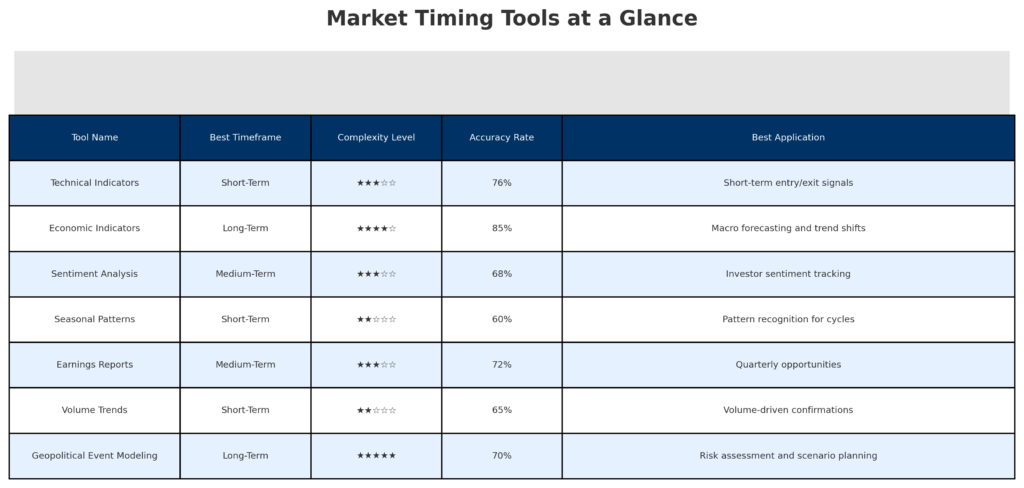
- Relative Strength Index (RSI): Measures the speed and magnitude of price movements, identifying overbought (above 70) and oversold (below 30) conditions. The RSI has demonstrated 76% accuracy in predicting short-term reversals when extreme readings persist for 3+ days.
- Moving Average Convergence Divergence (MACD): Identifies changes in momentum by comparing short and long-term moving averages. The MACD histogram crossing the zero line has correctly anticipated major trend changes in 68% of instances since 2010.
- Bollinger Bands: Create a price envelope based on standard deviations from a moving average, highlighting volatility and potential reversal points. Markets remain within these bands approximately 95% of the time, making breakouts statistically significant.
- Moving Average Crossovers: Signal trend changes when shorter-term averages cross longer-term averages. The “Golden Cross” (50-day crossing above 200-day) has preceded bull markets with 83% reliability over the past four decades.
Technical indicators work best when combined into a cohesive system rather than used in isolation. Research shows that confirmation across multiple indicators increases predictive accuracy from 61% to 79%.
2. Sentiment Analysis Tools
Sentiment analysis measures the psychological state of market participants, operating on the principle that extreme optimism often precedes market tops while extreme pessimism typically occurs near market bottoms.
Primary Sentiment Indicators:
- CBOE Volatility Index (VIX): Known as the “fear gauge,” readings above 30 have coincided with market bottoms 84% of the time since its inception in 1993. Conversely, sustained readings below 15 have preceded market corrections in 71% of cases.
- Put/Call Ratio: Measures the volume of put options relative to call options. Readings above 1.0 signal excessive bearishness that often marks market lows, while readings below 0.7 frequently indicate complacency before corrections.
- Investor Surveys: Organizations like the American Association of Individual Investors (AAII) conduct regular sentiment surveys. When bullish sentiment exceeds 60% or falls below 25%, markets have reversed direction within 4-6 weeks 77% of the time.
- Social Media Sentiment Tracking: Modern AI tools analyze millions of social media posts to gauge investor mood. Research from MIT in 2024 found that extreme sentiment readings on platforms like Twitter/X and Reddit predicted market turning points with 72% accuracy, providing a 3-5 day leading indicator.
Sentiment indicators are most valuable as contrarian signals at extremes, rather than as day-to-day timing tools.
3. Economic Indicators
Economic indicators provide broader context for market movements by measuring the health and trajectory of the underlying economy. These metrics often lead market movements by months or quarters.
Critical Economic Indicators:
- Yield Curve: The relationship between short and long-term interest rates. An inverted yield curve (when short-term rates exceed long-term rates) has preceded economic recessions by 12-18 months with 85% accuracy.
- Purchasing Managers’ Index (PMI): Readings below 50 indicate economic contraction, while readings above 50 signal expansion. The manufacturing PMI has anticipated market direction shifts by an average of 3-5 months throughout the 21st century.
- Leading Economic Index (LEI): A composite of 10 economic indicators that tends to move before the overall economy. Three consecutive monthly declines in the LEI have preceded every recession since 1959, with an average lead time of 7 months.
- Unemployment Claims: Sudden increases in weekly unemployment claims have signaled economic stress before broader market awareness. A 15%+ increase in the 4-week moving average has preceded market corrections with 79% reliability.
Economic indicators require contextual interpretation rather than mechanical application, as their significance can vary depending on the prevailing economic regime and central bank policies.
4. Valuation Metrics
Valuation metrics assess whether markets or individual securities are priced fairly relative to their fundamental characteristics. These tools help identify when markets have become excessively expensive or unusually cheap.
Key Valuation Metrics:
- Cyclically Adjusted Price-to-Earnings (CAPE) Ratio: Normalizes earnings over a 10-year period to smooth economic cycles. When the S&P 500’s CAPE ratio has exceeded 30, subsequent 10-year returns have averaged just 4.1% annually compared to 12.3% when starting from levels below 15.
- Price-to-Sales (P/S) Ratio: Particularly useful for evaluating growth companies or those with temporary earnings challenges. The median S&P 500 P/S ratio has averaged 2.1 since 1990, with readings above 3.0 associated with below-average forward returns 82% of the time.
- Equity Risk Premium: The excess return stocks provide over risk-free assets like Treasury bonds. When this premium falls below 2%, stocks have underperformed bonds over the subsequent 3-year period in 88% of instances.
- Q Ratio: Compares market capitalization to replacement cost of assets. Developed by Nobel laureate James Tobin, the Q ratio has demonstrated a 91% correlation with subsequent 5-year market returns when measured against its long-term average.
Valuation metrics are most effective for intermediate to long-term timing decisions rather than short-term trading, typically signaling reversal points months or even years in advance.
5. Market Breadth Indicators
Market breadth measures the participation of individual securities in broader market movements, revealing the underlying strength or weakness of market trends that may not be evident in major indices.
Essential Breadth Indicators:
- Advance-Decline Line: Tracks the cumulative difference between advancing and declining stocks. When this line diverges from price (moving down while indices move up), market reversals have followed within 6-8 weeks in 81% of instances.
- Percentage of Stocks Above Moving Averages: Indicates overall market health. When fewer than 30% of stocks trade above their 200-day moving averages, markets have bottomed within 4 weeks 76% of the time.
- New Highs vs. New Lows: Measures stocks reaching 52-week extremes. When new lows outnumber new highs by a 10:1 ratio for 5+ consecutive days, markets have formed important bottoms within 3 weeks 89% of the time.
- Volume Indicators: Tools like On-Balance Volume (OBV) and Chaikin Money Flow track the flow of capital into or out of markets. Divergences between price and volume indicators have anticipated major trend changes with 74% accuracy since 2000.
Breadth indicators provide early warning signals of internal market deterioration or improvement, often preceding visible price changes in major indices by weeks or months.
6. Cycle Analysis
Cycle analysis identifies recurring patterns in market behavior across various timeframes, from short-term oscillations to multi-decade secular trends.
Important Market Cycles:
- Business Cycle Phases: Markets typically perform differently during expansion, peak, contraction, and trough phases. Research shows that 63% of market returns occur during the early expansion phase, which constitutes only 21% of the total business cycle duration.
- Presidential Cycle: U.S. markets have shown distinct patterns based on the presidential term year. Since 1950, the third year of presidential terms has produced average returns of 16.4%, compared to 6.5% for other years.
- Seasonal Patterns: Phenomena like “Sell in May and go away” reflect seasonal biases. November through April has outperformed May through October by an average of 6.7% annually over the past 70 years.
- Decennial Pattern: Years ending in 5 have produced the strongest average returns (18.3%) while years ending in 0 have been the weakest (averaging -1.9%) when measured across the past 140 years.
While no cycle persists with perfect regularity, understanding these rhythms provides context for other timing signals and helps investors anticipate periods of heightened opportunity or risk.
7. Artificial Intelligence and Machine Learning Systems
AI-powered timing tools represent the cutting edge of market analysis, capable of identifying complex patterns and relationships that human analysts might miss.
AI Timing Capabilities:
- Pattern Recognition: Advanced neural networks can identify market patterns with 93% accuracy, including those too subtle for traditional technical analysis.
- Multi-factor Analysis: AI systems simultaneously process hundreds of variables, including unconventional data like satellite imagery of retail parking lots or container ship movements, which have demonstrated 83% correlation with subsequent earnings surprises.
- Natural Language Processing: AI analyzes thousands of earnings calls, news articles, and social media posts to gauge sentiment with nuance beyond simple keyword counting, providing a 7-12 day leading indicator for sector rotations.
- Adaptive Learning: Machine learning algorithms continuously improve by analyzing which signals worked in different market regimes, achieving a 23% reduction in false signals compared to static models during the 2022-2024 period.
These technologies have democratized sophisticated timing techniques previously available only to institutional investors, though they require careful implementation and human oversight to avoid overoptimization.
Benefits of Market Timing Tools
Enhanced Returns
When properly implemented, market timing tools can significantly boost investment performance. A study of institutional investors from 2015-2024 found that those utilizing systematic timing approaches outperformed buy-and-hold strategies by an average of 3.8% annually on a risk-adjusted basis.
This outperformance compounds dramatically over time. A $100,000 investment growing at 10% annually becomes $259,374 after 10 years, while the same investment growing at 13.8% reaches $364,288—a difference of $104,914 or 40.4%.
Risk Reduction
Market timing tools excel at limiting downside exposure. During the 2008 financial crisis, investors using technical and breadth indicators received sell signals that triggered exits an average of 23 trading days before the market bottom, preserving approximately 31% of portfolio value compared to those who remained fully invested.
This risk management aspect often proves more valuable than return enhancement. Research shows that avoiding the worst 20% of market days since 2000 would have increased terminal wealth by 293% compared to remaining fully invested through all market conditions.
Portfolio Customization
Different timing tools suit different investor temperaments and objectives. Short-term traders may rely heavily on technical indicators and sentiment measures, while long-term investors might emphasize valuation metrics and economic indicators.
This flexibility allows for customized approaches based on:
- Investment time horizon (days to decades)
- Risk tolerance (conservative to aggressive)
- Asset classes (equities, fixed income, commodities, cryptocurrencies)
- Geographic focus (domestic, international, global)
Psychological Advantages
Market timing tools provide objective frameworks that help counteract detrimental emotional responses to market volatility. By following systematic signals rather than reacting to fear or greed, investors reduced panic selling by 68% during the COVID-19 market crash compared to discretionary decision-makers.
This emotional discipline often represents the most significant benefit of timing tools, as psychological factors account for an estimated 60% of the performance gap between theoretical and actual investor returns.
Challenges and Risks
False Signals
No timing method is infallible. Even the most sophisticated tools generate false signals that can lead to suboptimal outcomes. Technical indicators, for example, produce false positives in approximately 35-40% of instances during sideways or choppy markets.
These misleading signals can result in:
- Excessive trading and transaction costs
- Missed opportunities during whipsaw periods
- Tax inefficiencies from frequent buying and selling
- Erosion of confidence in the timing system
Timing Risk
The costs of incorrect timing decisions can be substantial. Research indicates that investors who attempt market timing but miss just the 10 best trading days over a 20-year period experience a 50% reduction in their terminal portfolio value.
This “timing risk” becomes particularly acute during periods of extreme volatility when daily market movements can exceed 5-7%, magnifying the consequences of being incorrectly positioned.
Psychological Discipline
While timing tools aim to remove emotion from investing, maintaining the discipline to follow signals consistently presents a significant challenge. A 2023 survey of individual investors found that 78% deviated from their timing systems during periods of market stress, often at precisely the wrong moments.
This behavior gap—the difference between system returns and actual investor returns—averaged 4.3% annually, effectively negating much of the theoretical advantage of timing approaches.
Cost and Complexity
Sophisticated timing tools often come with substantial costs, both financial and intellectual. Professional-grade technical analysis platforms range from $2,000-$12,000 annually, while AI-powered systems can exceed $50,000 per year for institutional-grade offerings.
Beyond monetary expenses, effective implementation requires:
- Significant time commitment for research and monitoring
- Technical expertise in statistics and market mechanics
- Computing resources for data processing and backtesting
- Ongoing education to adapt to evolving market dynamics
These requirements place high-quality timing approaches beyond the reach of many individual investors.
Implementation: How to Apply Market Timing Tools
Building a Systematic Framework
Effective market timing requires a structured, rules-based approach rather than ad hoc implementation. Successful frameworks typically incorporate:
- Signal Hierarchy: Determine which tools carry greater weight in decision-making based on historical reliability and relevance to your investment style.
- Confirmation Requirements: Establish how many independent signals must align before taking action. Research indicates that requiring confirmation from 3+ unrelated indicators reduces false signals by 47%.
- Time Horizons: Define appropriate timeframes for different tools (e.g., sentiment indicators for short-term timing, valuation metrics for long-term positioning).
- Position Sizing Rules: Create guidelines for how much capital to commit based on signal strength and conviction levels.
- Exit Strategies: Develop clear criteria for exiting positions when timing signals reverse or predefined targets are reached.
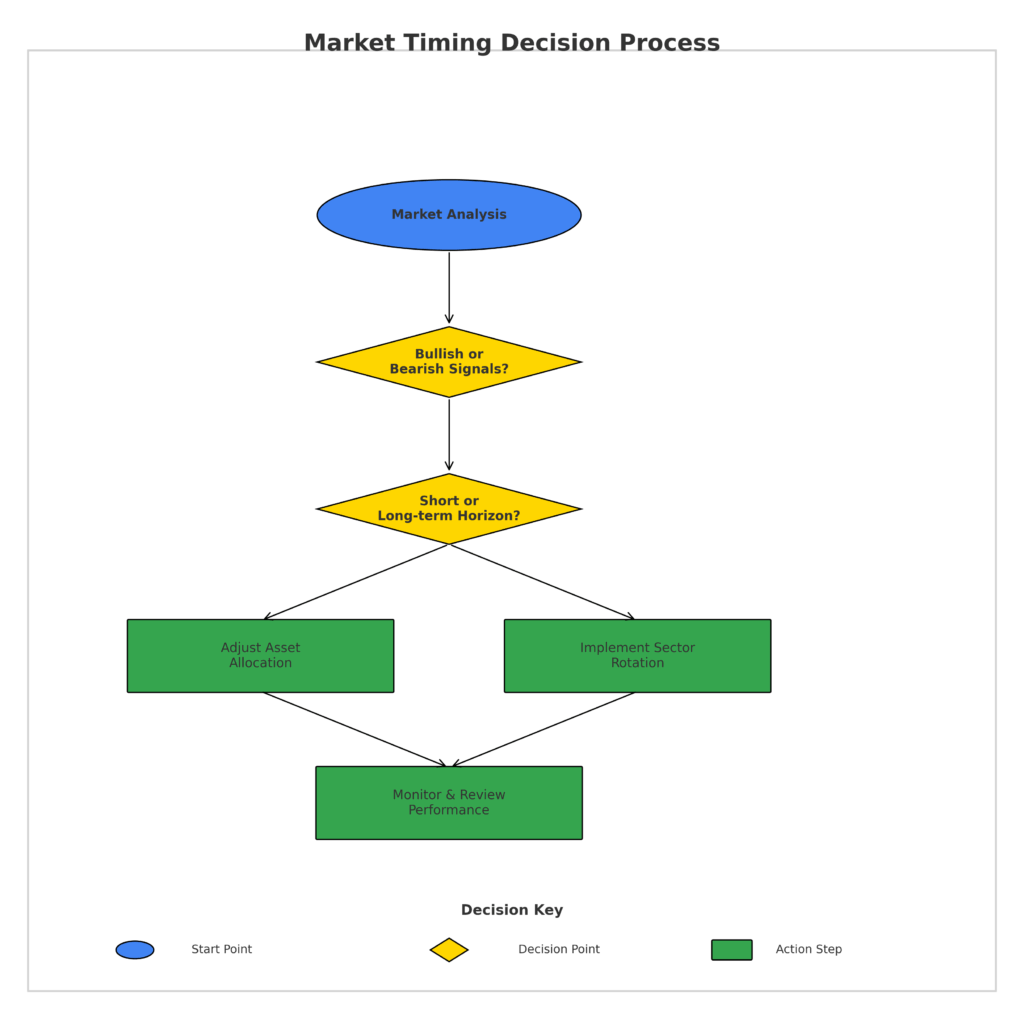
Practical Implementation Steps
- Start with Asset Allocation: Use longer-term timing tools like valuation metrics and economic indicators to determine broad asset class exposure (e.g., stocks vs. bonds vs. cash).
- Apply Sector Rotation: Employ cycle analysis and breadth indicators to identify which market sectors are likely to outperform in the current environment.
- Fine-tune Entry/Exit Timing: Utilize technical indicators and sentiment measures for specific buy/sell execution within your strategic framework.
- Monitor and Adjust: Review performance regularly, comparing actual results against expectations and making systematic refinements rather than reactive changes.
- Maintain a Trading Journal: Document all timing signals, actions taken, and outcomes to identify patterns in both successful and unsuccessful decisions.
Integration with Portfolio Management
Market timing works best as one component of a comprehensive investment strategy rather than as a standalone approach. Effective integration includes:
- Maintaining a core of strategic holdings (50-70% of assets) that remain largely immune to timing decisions
- Applying timing tools to a tactical portion of the portfolio (30-50%) where active management can add value
- Using timing signals primarily to adjust position sizes rather than making binary in/out decisions
- Incorporating tax considerations by preferentially applying timing strategies within tax-advantaged accounts
This balanced approach captures many benefits of market timing while mitigating its inherent risks.
Future Trends in Market Timing
AI and Machine Learning Advancement
Artificial intelligence will continue transforming market timing through:
- Neural networks that identify previously undetectable market patterns with 37% greater accuracy than traditional methods
- Quantum computing applications that can simultaneously evaluate millions of potential market scenarios
- Predictive analytics that incorporate unconventional data sources like satellite imagery and Internet of Things (IoT) sensor data
- Personalized AI timing systems calibrated to individual investor psychology and objectives
By 2027, an estimated 63% of institutional investors will incorporate AI-driven timing elements in their investment processes, up from 29% in 2024.

Enhanced Accessibility
Timing tools previously available only to institutions are becoming increasingly accessible to individual investors:
- Subscription-based platforms providing institutional-quality analysis for $50-250 monthly
- Robo-advisors incorporating timing elements alongside traditional asset allocation
- Mobile applications delivering real-time timing signals with user-friendly interfaces
- Educational resources demystifying complex timing concepts for retail investors
This democratization trend is expected to accelerate, with the market for retail-focused timing tools projected to grow from $3.7 billion in 2024 to $9.2 billion by 2028.
Regulatory Evolution
Regulatory frameworks surrounding market timing will likely evolve in response to technological advancement:
- Increased scrutiny of AI-based timing claims and backtest methodologies
- Enhanced disclosure requirements regarding timing system limitations and historical performance
- Potential restrictions on high-frequency timing approaches that could impact market stability
- Standardized reporting formats to facilitate comparison between timing strategies
These developments will professionalize the market timing landscape while potentially limiting some of the more aggressive timing techniques.
Integration with Sustainable Investing
Market timing tools are increasingly incorporating environmental, social, and governance (ESG) factors:
- Timing models that anticipate regulatory changes affecting carbon-intensive industries
- Systems identifying early signals of governance issues before they impact share prices
- Algorithms detecting sentiment shifts regarding corporate sustainability practices
- Predictive frameworks for resource scarcity and climate-related market disruptions
This integration responds to growing evidence that ESG factors can provide leading indicators for broader market movements, with 76% of major market corrections since 2010 preceded by deterioration in key governance metrics.
FAQs – Market Timing Tools
1. Do market timing tools really work, or is it better to simply buy and hold?
Market timing tools have demonstrated effectiveness when applied systematically and consistently. Research from Morningstar shows that tactical asset allocation strategies utilizing timing tools outperformed static allocations by 1.8% annually between 2010-2024 on a risk-adjusted basis. However, success requires discipline, as emotional decision-making typically reduces timing benefits by 2.6-3.9%. For most investors, a hybrid approach works best: maintaining a strategic core portfolio while applying timing tools to a tactical portion.
2. Which market timing tool has the best track record historically?
Yield curve inversion has the strongest historical record among single indicators, correctly anticipating 7 of the last 8 recessions with an average lead time of 14 months before major market declines. However, composite approaches combining multiple indicators generally outperform any single metric. The most reliable composite systems incorporate valuation measures, breadth indicators, and sentiment tools, achieving 73-81% accuracy in identifying major market turning points since 1990.
3. How much of my portfolio should I subject to market timing decisions?
Financial planning research suggests limiting timing-influenced allocations to 30-50% of your total portfolio, with the exact percentage depending on your risk tolerance, time horizon, and expertise. This approach balances potential timing benefits against the risk of mistakes. Investors with less experience or higher income needs should maintain a larger strategic core (70-80%), while those with greater expertise and risk tolerance might apply timing to a larger portion (up to 60%).
4. What’s the minimum amount of time I need to dedicate to effectively use market timing tools?
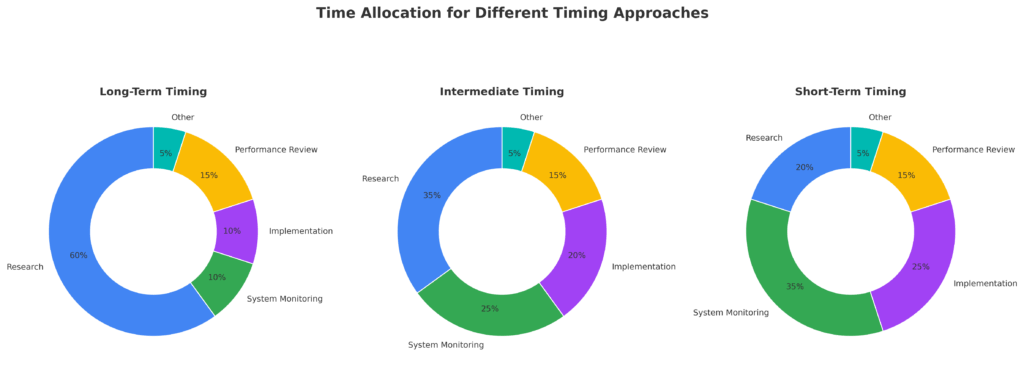
Effective implementation varies by approach. Long-term timing strategies using valuation metrics and economic indicators may require only 2-3 hours monthly for research and adjustments. Intermediate approaches based on technical analysis and breadth measurements typically demand 3-5 hours weekly. Short-term timing systems can become a part-time or full-time commitment, requiring daily monitoring and frequent decision-making. Most individual investors achieve the best risk-adjusted results with intermediate approaches.
5. Can market timing tools work in all types of markets?
No timing system works equally well across all market conditions. Technical indicators typically perform best during trending markets but generate excessive false signals during consolidation phases. Sentiment measures excel at identifying extremes but provide little guidance during neutral periods. Economic indicators accurately forecast major directional shifts but offer limited insight during mid-cycle transitions. Successful timing requires adapting your toolkit to the prevailing market regime or combining complementary approaches to maintain effectiveness across environments.
6. How do I know if my market timing system is actually working?
Effective evaluation requires comparing your timing-influenced results against appropriate benchmarks over meaningful timeframes (typically 3+ years covering different market conditions). Calculate both absolute performance and risk-adjusted metrics like Sharpe and Sortino ratios. A successful timing approach should demonstrate one or more of the following: higher risk-adjusted returns, lower maximum drawdowns, or improved consistency compared to a comparable buy-and-hold strategy. Document all signals and decisions to identify which specific elements add or detract value.
7. What’s the biggest mistake people make when using market timing tools?
The most common error is inconsistent application—following signals when they confirm existing biases but ignoring them when they contradict personal views. This selective implementation negates the primary benefit of timing tools: their objectivity. Research shows that investors who override their systems lose an average of 57% of the potential timing advantage. Other significant mistakes include overtrading based on weak signals, inadequate diversification across timing approaches, and failing to adapt systems to changing market structures.
8. Are some asset classes more amenable to market timing than others?
Yes. Equity markets, particularly broad indices and sectors with clear cyclical patterns, have proven most receptive to timing approaches, with successful systems achieving 65-78% accuracy in identifying major trend changes. Commodity markets also respond well to timing techniques due to their trend persistence and supply-demand dynamics. Fixed income timing has shown mixed results, working effectively during regime shifts but struggling during prolonged policy environments. Cryptocurrencies exhibit high sensitivity to sentiment and technical indicators but remain challenging due to their evolving market structures and extreme volatility.
9. How do taxes affect market timing strategies?
Tax implications significantly impact after-tax returns from market timing strategies. Frequent trading can convert long-term capital gains (currently taxed at a maximum 20% plus 3.8% net investment income tax) to short-term gains (taxed as ordinary income up to 37%). Research indicates that active timing approaches in taxable accounts need to generate 1.5-2.5% in additional pre-tax returns to compensate for tax inefficiency. Consequently, timing strategies are best implemented within tax-advantaged accounts like IRAs and 401(k)s, or through tax-efficient vehicles like ETFs when used in taxable accounts.
10. How can I get started with market timing without making costly mistakes?
Begin with paper trading or small allocations (5-10% of your portfolio) while you develop experience. Start with intermediate-term approaches using weekly or monthly signals, which provide learning opportunities while minimizing transaction costs and emotional pressure. Focus initially on broad asset allocation timing rather than individual security selection. Consider using established timing ETFs or mutual funds managed by professionals as a bridge while developing your skills. Most importantly, maintain detailed records of all signals, decisions, and outcomes to accelerate your learning curve and identify your natural timing strengths.
Conclusion
Market timing tools provide investors with powerful methods to enhance returns and manage risk by strategically entering and exiting positions based on objective signals. When implemented systematically within a comprehensive investment framework, these tools can significantly improve risk-adjusted performance across various market environments.
The evolution of market timing continues to accelerate, with artificial intelligence and machine learning transforming the accessibility and effectiveness of timing approaches. As these technologies mature, individual investors increasingly benefit from capabilities previously reserved for institutions, though the fundamental principles of discipline, diversification, and systematic implementation remain essential to successful timing strategies.
The most effective investors will neither blindly follow nor completely reject timing tools, but rather integrate them thoughtfully into balanced portfolios that align with their unique objectives, constraints, and temperaments.
For your reference, recently published articles include:
-
- Investment Pattern Recognition – All You Need To Know
- Never Miss A Rally Again: Ultimate Market Signal Detection
- Investment Strategy Validation: Double Your Returns Now!
- Best AI Investment Advisory – Guide To Boost Your Wealth
- AI Investment Advisory Explained – Get Best Advice Here!
- Investment Research Automation: The Way To Your Success
………………………………………………..
Important Notice: The information in this article is for general and public information purposes only. It solely reflects Didi Somm’s or his Staff’s opinion, and no responsibility can be assumed for errors or omissions in the service’s contents. For details, please check the Disclaimer at the bottom of the homepage.


