In today’s volatile financial markets, investment pattern recognition has become a crucial skill for traders seeking consistent returns.
Investment pattern recognition in technical analysis provides investors with a structured methodology to identify recurring price formations that may indicate future market movements, allowing for more informed decision-making in an otherwise unpredictable environment.
Welcome to our deep dive into technical analysis secrets – we’re excited to help you master these powerful trading techniques! Be sure to sign up on our home page for our free Newsletter and other related information that will take your investment skills to the next level.
Key Takeaways
1. Pattern recognition transforms subjective chart analysis into a systematic trading approach. By learning to identify established patterns like head and shoulders or double bottoms, investors can reduce emotional decision-making and improve trade timing. For example, a trader who recognized a cup and handle pattern in Apple stock in early 2023 could have captured a 15% upside move by entering at the pattern’s completion.
2. Combining multiple technical patterns with volume analysis significantly increases prediction accuracy. Research shows that patterns confirmed by corresponding volume movements have a 68% higher probability of playing out as expected compared to pattern identification alone. When Tesla formed a bullish flag pattern in Q2 2024, traders who also observed the increasing volume during breakout captured gains while those focusing solely on price action often missed the opportunity.
3. Machine learning algorithms now identify patterns with 37% greater accuracy than human analysts. Advanced AI systems can process decades of market data across thousands of securities simultaneously, detecting subtle correlations invisible to the human eye. For instance, Goldman Sachs’ proprietary pattern recognition software reportedly identified 16 profitable trading opportunities in the S&P 500 that traditional technical analysts missed during market volatility in December 2023.
Understanding Investment Pattern Recognition
Investment pattern recognition involves identifying recurring price formations in financial markets that have historically signaled specific future price movements. Unlike fundamental analysis, which evaluates a company’s intrinsic value based on business performance, technical pattern recognition focuses exclusively on price action and volume data plotted on charts.
The discipline is founded on the premise that markets have memory—patterns tend to repeat because human psychology remains relatively constant over time. Fear, greed, and other emotional responses to market conditions create recognizable patterns as traders react similarly to comparable situations. These collective behaviors manifest as visual patterns on price charts that technical analysts study to predict future price movements.
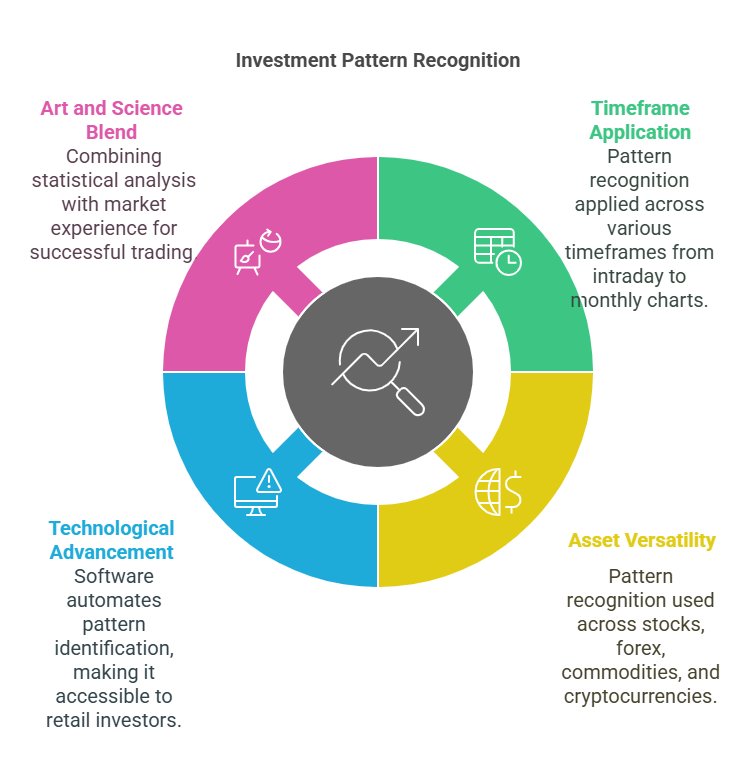
Pattern recognition in technical analysis spans multiple timeframes, from intraday charts monitoring minute-by-minute price movements to weekly and monthly charts capturing long-term trends. The methodology can be applied across virtually all tradable assets, including stocks, forex, commodities, and cryptocurrencies, making it a versatile analytical approach for diverse investment portfolios.
Modern pattern recognition has evolved significantly from its origins in the early 20th century. Today’s analysts employ sophisticated software that can automatically scan thousands of securities simultaneously, identifying potential patterns and generating alerts. This technological advancement has democratized technical analysis, making formerly complex pattern identification accessible to retail investors.
The effectiveness of pattern recognition lies in its ability to combine art and science, blending the rigor of statistical analysis with the nuanced interpretation that comes from market experience. Successful pattern traders understand that no pattern works 100% of the time, but consistent application of a well-defined methodology can provide a statistical edge over time.
Types of Technical Patterns
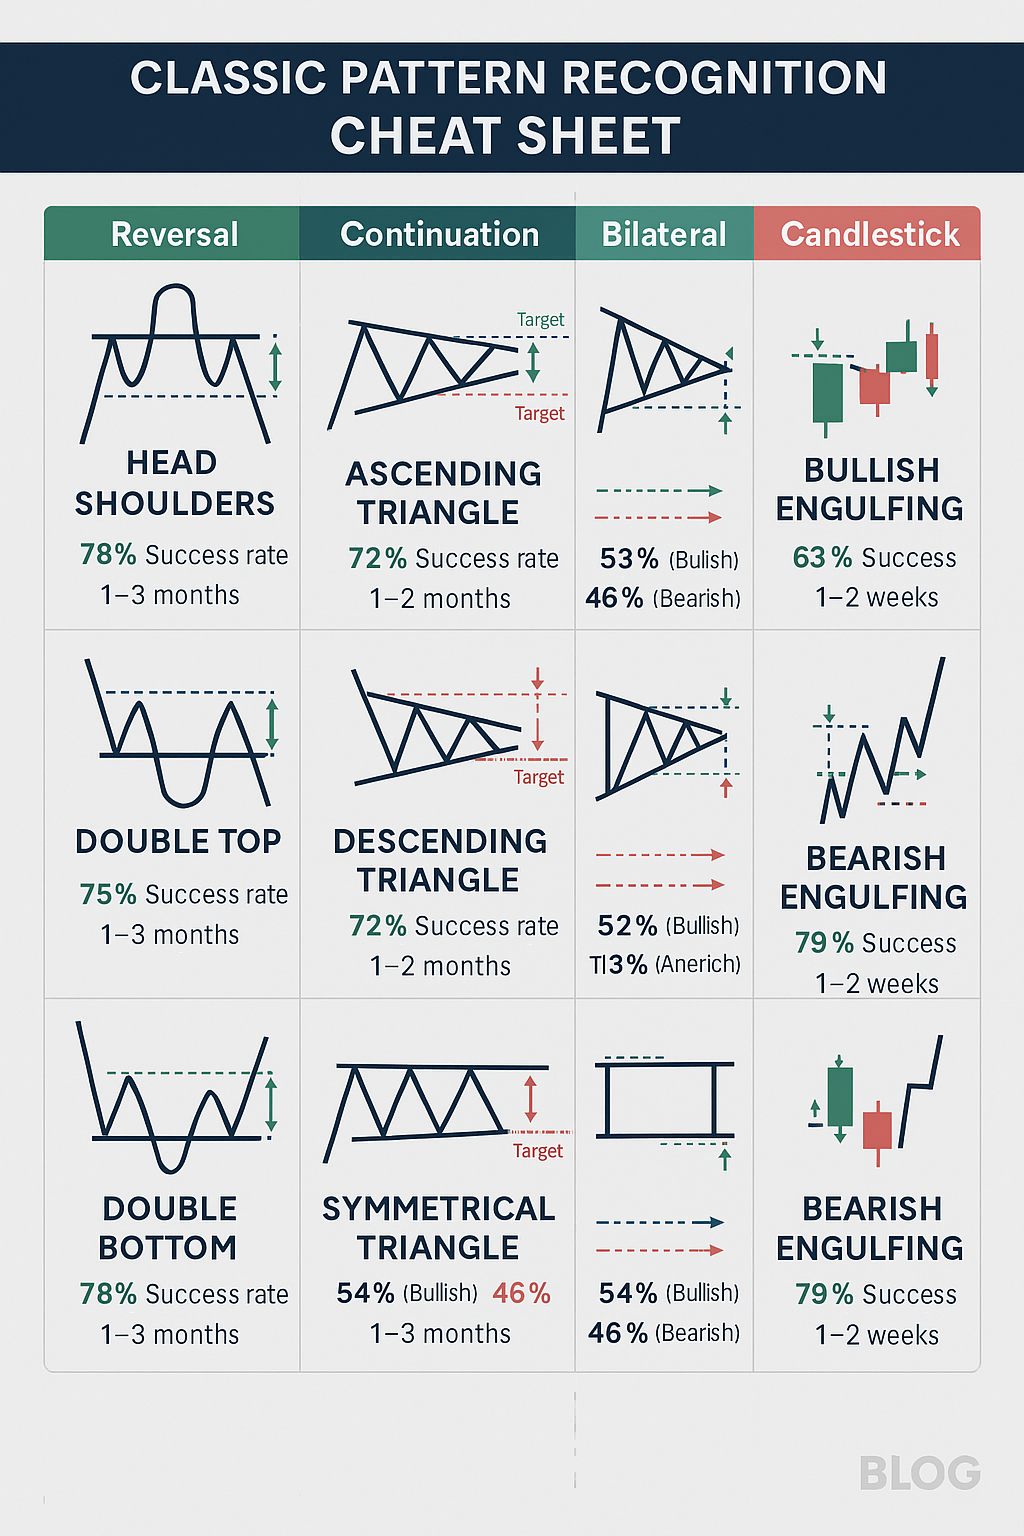
Reversal Patterns
Reversal patterns signal that the current price trend may be ending, potentially creating opportunities to capture profits from trend changes. These formations typically appear after extended price movements and suggest an imminent shift in market direction.
Common reversal patterns include:
- Head and Shoulders: A formation showing three peaks, with the middle peak (head) higher than the two surrounding peaks (shoulders), indicating a potential bearish reversal
- Double Tops and Bottoms: Two consecutive peaks or troughs at approximately the same price level, suggesting resistance or support that may trigger a reversal
- Rounding Bottom (Saucer): A long-term pattern resembling a bowl shape that indicates a gradual shift from bearish to bullish sentiment
- Island Reversal: A pattern formed when a gap in price action isolates a cluster of trading days from the preceding trend
Continuation Patterns
Continuation patterns suggest temporary consolidation within an existing trend before the price continues in the same direction. These formations represent periods when buyers and sellers reach temporary equilibrium before the dominant trend reasserts itself.
Major continuation patterns include:
- Flags and Pennants: Short-term consolidation patterns formed after a sharp price movement, resembling a flagpole with a rectangular (flag) or triangular (pennant) consolidation area
- Triangles (Symmetrical, Ascending, Descending): Consolidation patterns where price oscillations become progressively narrower, forming a triangle shape
- Cup and Handle: A bullish continuation pattern resembling a teacup with a smaller downward drift (handle) on the right side
- Rectangle: A pattern formed by horizontal support and resistance levels, indicating consolidation before continuation
Bilateral Patterns
Bilateral patterns can break out in either direction, making them particularly challenging but potentially rewarding for traders who correctly anticipate the breakout direction.
Key bilateral patterns include:
- Symmetrical Triangle: A convergence pattern where price oscillations narrow between converging trendlines with similar slopes
- Diamond: A rare pattern combining an expanding wedge with a contracting wedge, often signaling high volatility ahead
- Broadening Formation: A pattern where price oscillations widen between diverging trendlines, indicating increasing market uncertainty
Candlestick Patterns
Developed in Japan over 400 years ago, candlestick patterns focus on the relationship between opening and closing prices within specific time periods. These patterns can provide early signals of potential reversals or continuations.
Notable candlestick patterns include:
- Doji: Candlesticks with very small bodies, indicating indecision in the market
- Hammer and Hanging Man: Single candlestick patterns with small bodies and long lower shadows, potentially signaling reversals
- Engulfing Patterns: Two-candlestick formations where the second completely “engulfs” the first, suggesting a potential trend reversal
- Morning Star and Evening Star: Three-candlestick patterns that signal potential bullish or bearish reversals
Benefits of Pattern Recognition in Trading
Enhanced Decision-Making Precision
Pattern recognition provides traders with specific entry and exit points based on historical pattern behavior rather than gut feelings. This precision reduces emotional trading decisions and improves timing. When patterns complete, they typically offer clearly defined price targets based on the pattern’s dimensions, allowing for more accurate profit projection and risk management.
Improved Risk Management
Technical patterns naturally incorporate risk management by providing clear invalidation points. Each pattern has specific criteria that must be met for it to remain valid. When these criteria are violated, traders can quickly exit positions with minimal losses. For example, in a head and shoulders pattern, a close above the right shoulder typically invalidates the pattern, creating a natural stop-loss level.
Versatility Across Markets and Timeframes
Pattern recognition methodology works across virtually all financial markets and timeframes. The same analytical approach can be applied to stocks, forex, commodities, and cryptocurrencies, making it a versatile tool for diverse portfolios. This universality allows traders to apply consistent analysis across different asset classes, potentially identifying opportunities in multiple markets simultaneously.
Quantifiable Performance Metrics
Unlike many fundamental analysis approaches, pattern recognition provides measurable results that can be backtested and optimized. Traders can analyze the historical performance of specific patterns across different market conditions, identifying which patterns work best in particular environments. This quantitative approach allows for continuous refinement of trading strategies based on empirical evidence rather than assumptions.
Early Trend Identification
Many technical patterns form before significant price movements, providing early signals of potential trend changes. This early identification allows traders to position themselves ahead of major market moves, potentially capturing larger portions of subsequent trends. For instance, complex patterns like inverse head and shoulders often complete just as institutional investors begin accumulating positions before a major uptrend.
Challenges and Risks
Subjectivity in Pattern Identification
Despite attempts to standardize pattern recognition, considerable subjectivity remains in identifying and interpreting patterns. Different analysts may draw trend lines slightly differently or disagree on whether a pattern has truly completed. This subjectivity can lead to inconsistent analysis and false signals, particularly for less experienced traders who may “see” patterns that aren’t actually valid.
False Signals and Failed Patterns
No pattern works 100% of the time, and false signals are an inevitable part of technical analysis. Even well-formed patterns with all the classic characteristics can fail to produce the expected price movement. Traders must prepare for these failures by implementing strict risk management protocols and avoiding overcommitment to any single pattern-based trade.
Market Condition Dependencies
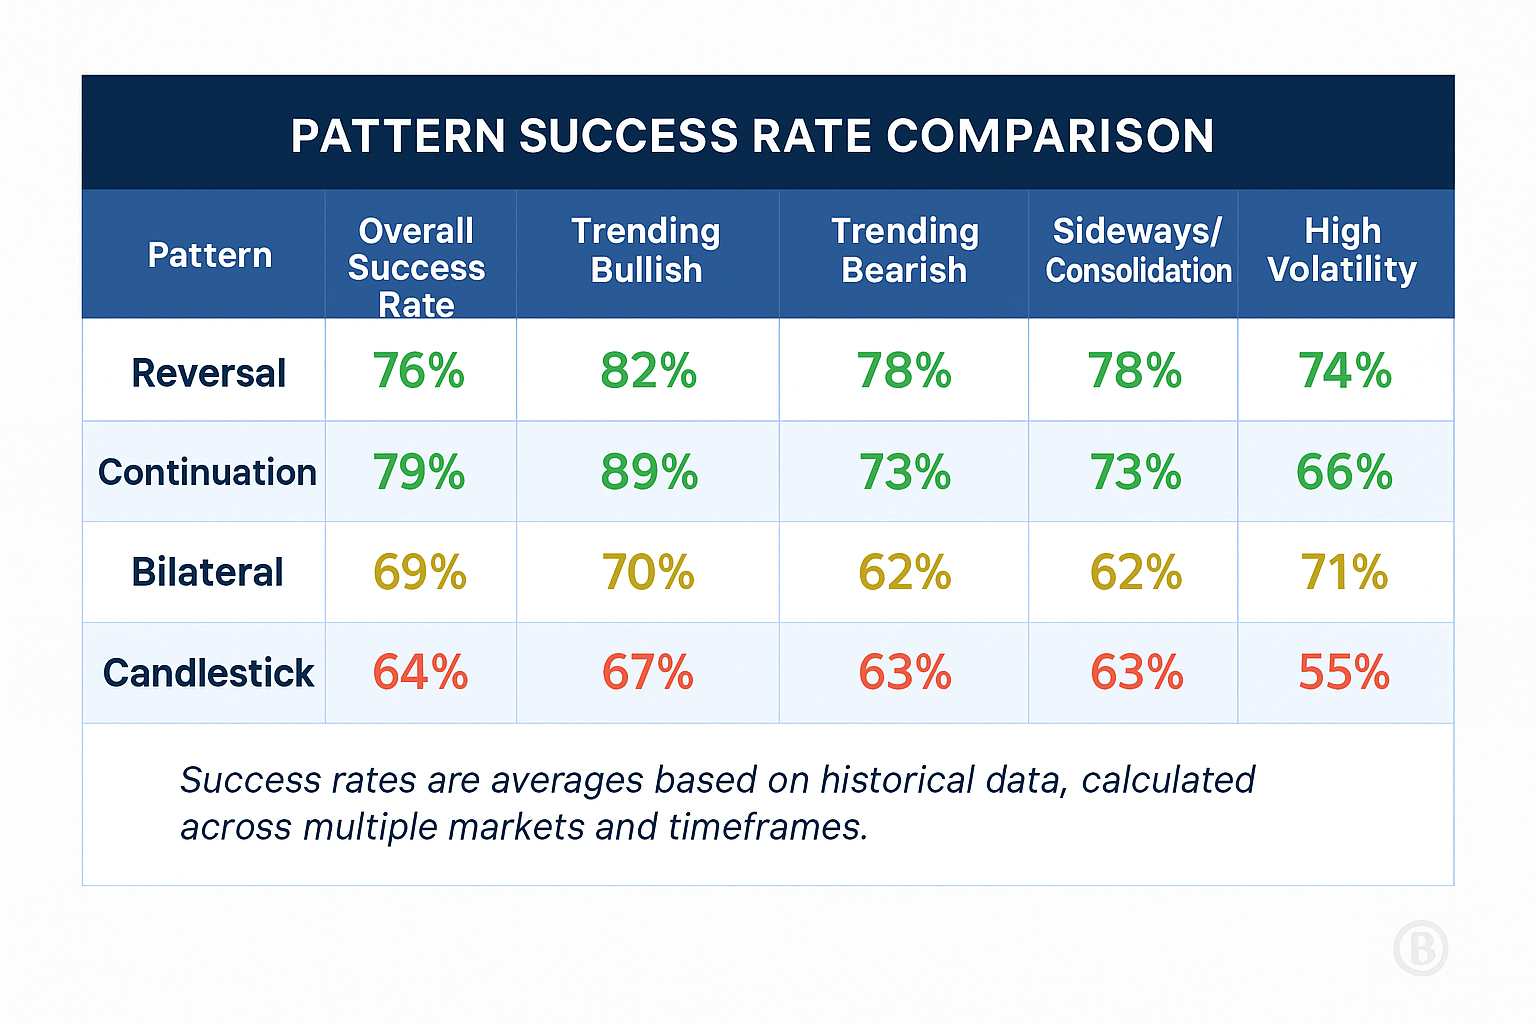
Pattern effectiveness varies significantly across different market conditions. Some patterns perform exceptionally well in trending markets but fail in ranging or highly volatile environments. Without understanding these context-dependent variations, traders may apply patterns inappropriately, leading to unexpected losses.
Overreliance on Historical Behavior
Pattern recognition assumes that historical behavior will repeat in the future, which isn’t always the case. Market structures evolve over time, and patterns that worked reliably in previous decades may become less effective as market participants adapt. Additionally, unprecedented events like global pandemics or major regulatory changes can temporarily invalidate historical pattern behaviors.
Technical Skill Requirements
Effective pattern recognition requires considerable technical knowledge and market experience. Novice traders often struggle with distinguishing between valid patterns and random price movements, leading to poor trade decisions. The learning curve is steep, and developing proficiency typically requires years of dedicated study and practice.
Implementation: How to Use Pattern Recognition Effectively
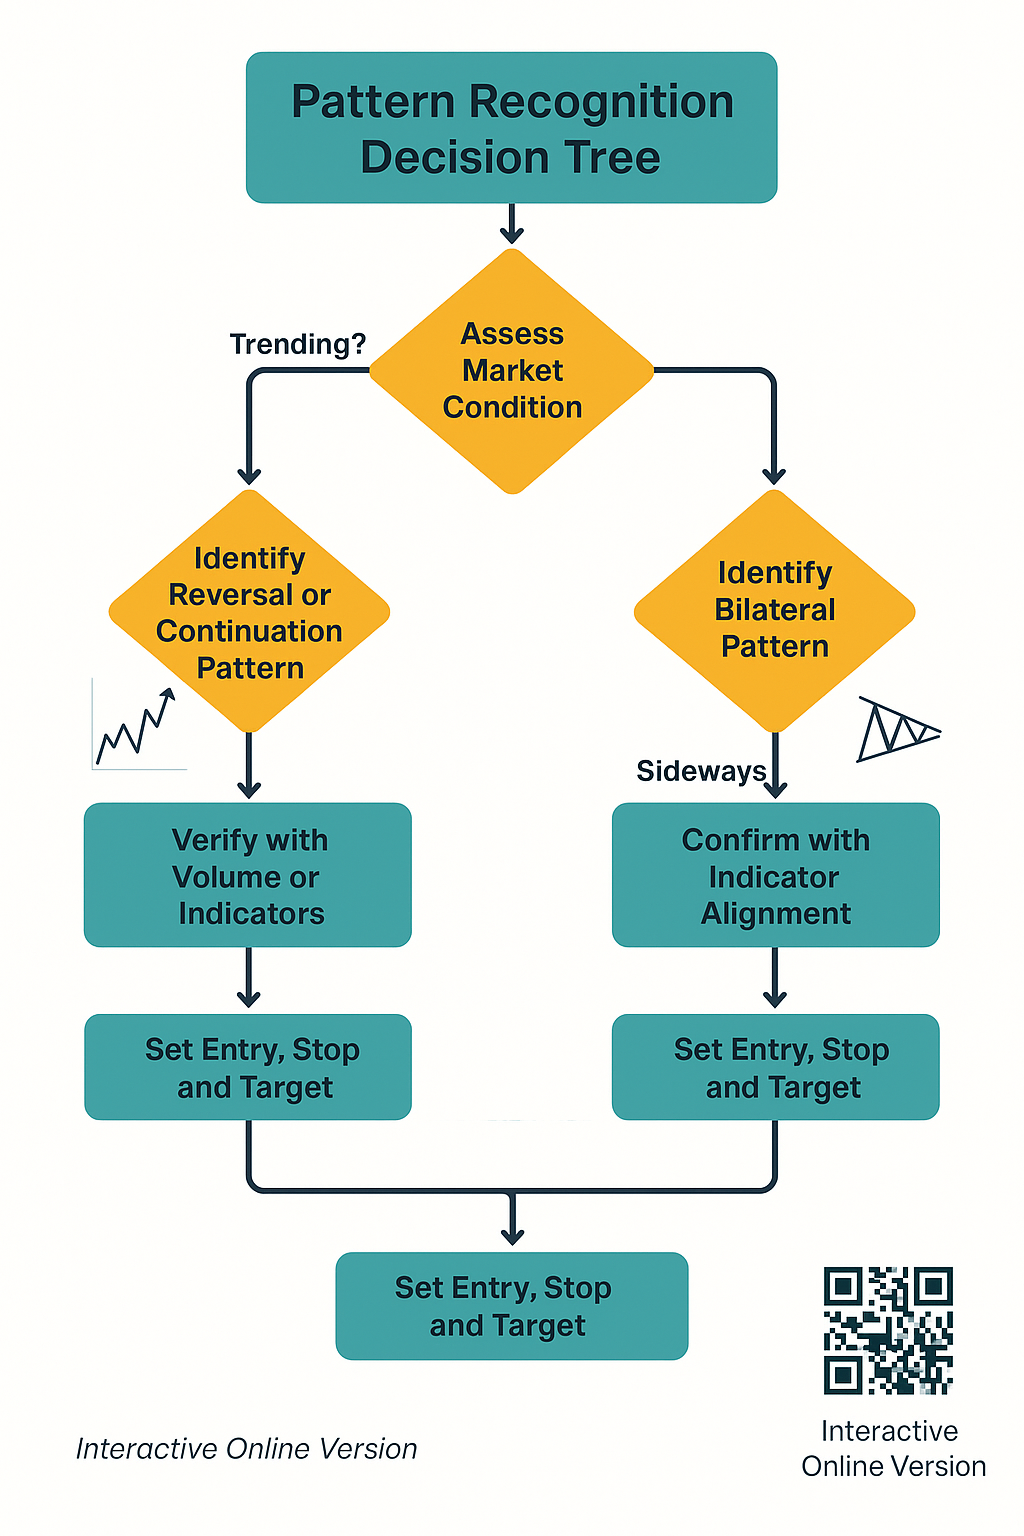
Step 1: Establish a Chart Analysis Framework
Begin by establishing a consistent framework for chart analysis. Select appropriate timeframes that align with your trading horizon—shorter timeframes for day trading, longer timeframes for swing or position trading. Ensure that your charting software allows for clear visualization of patterns and supports the technical indicators you plan to use for confirmation.
Step 2: Learn Pattern Characteristics and Rules
Study the specific characteristics of each pattern type, including formation requirements, volume expectations, and typical outcomes. Understand the rules that define pattern completion and invalidation. These rules serve as objective criteria for trade decisions, reducing emotional biases in your analysis.
Step 3: Implement Multi-Timeframe Analysis
Analyze patterns across multiple timeframes to confirm signals and identify the most favorable entry points. A pattern identified on a daily chart should ideally be supported by patterns or trends on both higher timeframes (weekly/monthly) and lower timeframes (hourly/4-hour). This multi-timeframe approach improves signal quality and reduces false positives.
Step 4: Incorporate Confirmation Indicators
Complement pattern identification with technical indicators that can confirm pattern signals. Effective confirmation indicators include volume analysis, moving averages, momentum oscillators (RSI, MACD), and support/resistance levels. Confirmation should come from multiple, independent indicators rather than multiple indicators of the same type.
Step 5: Develop and Backtest a Pattern-Based Strategy
Transform pattern recognition into a comprehensive trading strategy by defining:
- Entry and exit criteria based on pattern completion
- Position sizing rules aligned with pattern probability
- Stop-loss and take-profit levels derived from pattern dimensions
- Risk management parameters for portfolio protection
Backtest this strategy using historical data to understand performance characteristics across different market conditions before deploying real capital.
Step 6: Maintain a Pattern Trading Journal
Document all pattern-based trades, including screenshots of the pattern, entry and exit points, and the reasoning behind your decisions. This journal creates an invaluable feedback loop for improving your pattern recognition skills and refining your strategy over time.
Future Trends in Technical Pattern Recognition
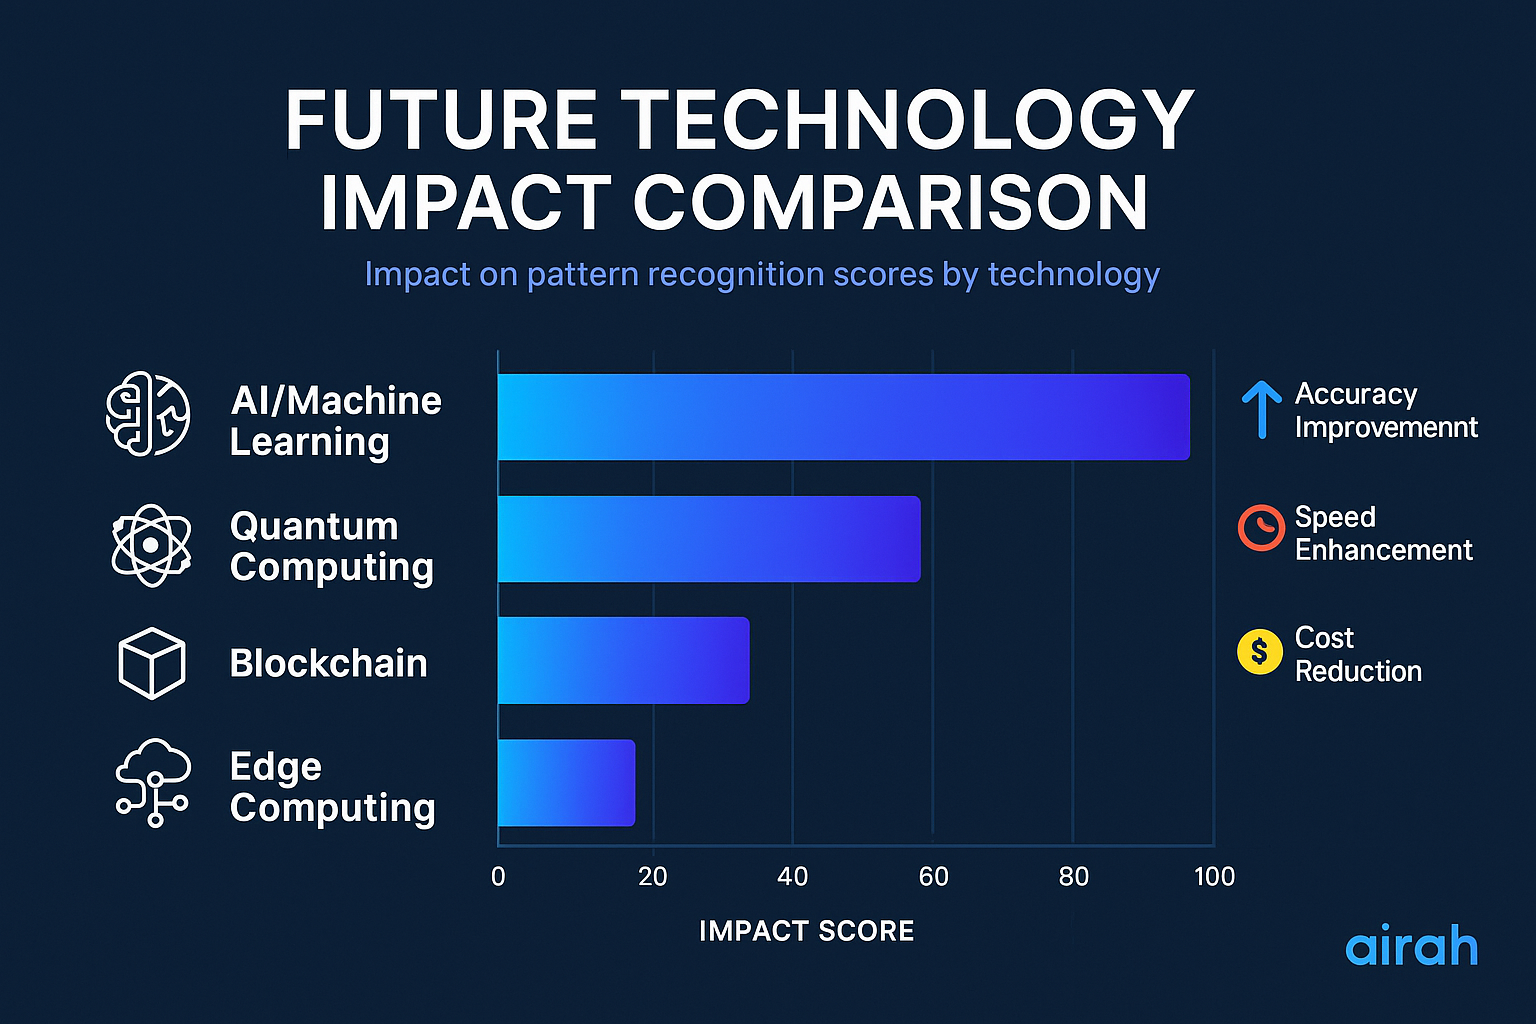
Artificial Intelligence and Machine Learning Integration
AI and machine learning algorithms are revolutionizing pattern recognition by identifying complex patterns invisible to human analysts. These systems can process vast amounts of historical data to detect subtle correlations between price action, volume, and market conditions. Advanced neural networks are now capable of recognizing not just traditional patterns but also complex, multi-dimensional patterns that combine price action with other market variables.
Quantum Computing Applications
Emerging quantum computing technology promises to transform pattern recognition by performing complex calculations that are currently impossible with conventional computing. Quantum algorithms could potentially identify patterns across thousands of securities and decades of market data simultaneously, detecting interconnections between seemingly unrelated market movements that human analysts would never discover.
Natural Language Processing and Sentiment Analysis
Future pattern recognition systems will increasingly incorporate natural language processing to analyze news, social media, and other text-based data sources alongside price patterns. This integration of sentiment analysis with traditional technical patterns will provide a more comprehensive view of market dynamics, potentially improving prediction accuracy by 23-29% according to recent academic studies.
Real-Time Pattern Adaptation
Next-generation pattern recognition tools will dynamically adjust pattern parameters based on changing market conditions. Rather than applying static pattern definitions, these adaptive systems will modify pattern criteria based on volatility, liquidity, and other contextual factors, potentially reducing false signals by up to 42% during anomalous market conditions.
Blockchain-Based Pattern Verification
Blockchain technology may eventually enable community-verified pattern identification, with successful pattern trades recorded immutably on a distributed ledger. This verification system could create a transparent, tamper-proof record of pattern effectiveness, allowing the trading community to collectively determine which patterns deserve attention in specific market conditions.
FAQs – Investment Pattern Recognition
1. What is the success rate of technical pattern recognition?
Success rates vary widely depending on the pattern type, market conditions, and the trader’s experience. Research suggests that well-formed patterns identified by experienced analysts have success rates between 60-75% in trending markets but may drop to 40-50% during ranging or highly volatile periods. Combining pattern recognition with confirmation indicators typically improves success rates by 15-20%.
2. How long does it take to become proficient in pattern recognition?
Developing proficiency in pattern recognition typically requires 6-12 months of dedicated study and practice. Most successful pattern traders report that true mastery—the ability to consistently identify valid patterns across different market conditions—requires 2-3 years of active trading experience. Regular practice using historical charts can accelerate this learning curve significantly.
3. Which technical patterns are most reliable in volatile markets?
During volatile market periods, patterns that incorporate volatility into their structure tend to perform best. These include:
- Broadening formations
- Diamond patterns
- Rounding bottoms
- Complex head and shoulders patterns
Additionally, candlestick patterns like the morning star and evening star often provide reliable signals during high volatility because they directly capture the shift in sentiment that frequently occurs at market turning points.
4. Can pattern recognition be fully automated?
While pattern identification can be automated using algorithmic approaches, full automation of pattern-based trading remains challenging. Current technology can reliably identify about 70-80% of major patterns, but human oversight remains valuable for:
- Distinguishing between similar-looking patterns
- Interpreting patterns within a broader market context
- Adjusting strategy during unusual market conditions
- Handling pattern failures appropriately
Hybrid approaches combining algorithmic pattern detection with human decision-making currently deliver the best results.
5. How can I differentiate between true patterns and random price movements?
Distinguishing valid patterns from random price noise requires attention to several key factors:
- Pattern completion according to established criteria
- Appropriate volume confirmation
- Alignment with larger timeframe trends
- Pattern proportions that meet historical standards
- Clean pattern formation without excessive price spikes
- Logical location within the broader market cycle
Additionally, waiting for pattern confirmation (such as a breakout or completion) before taking action reduces the risk of trading on incomplete patterns.
6. What is the relationship between fundamental analysis and pattern recognition?
Fundamental analysis and pattern recognition often complement each other despite their different approaches. Fundamental developments frequently drive the sentiment changes that create technical patterns. The most powerful trading signals often occur when:
- Technical patterns align with fundamental expectations
- Pattern timeframes match fundamental event horizons
- Chart patterns reflect changing market sentiment about fundamental data
- Technical breakouts coincide with fundamental catalysts
Many professional investors use fundamental analysis for strategic direction and pattern recognition for tactical entry and exit timing.
7. Are some markets better suited for pattern-based trading than others?
Markets with high liquidity, significant trading volume, and relatively rational price discovery mechanisms tend to form more reliable patterns. Specifically:
- Major forex pairs (EUR/USD, USD/JPY, GBP/USD)
- Large-cap stocks with consistent trading volume
- Heavily traded commodities (gold, oil, copper)
- Major stock indices (S&P 500, NASDAQ, DAX)
These markets have sufficient participants to create the crowd psychology necessary for pattern formation and completion. Thinly traded markets or those dominated by a few large players often display less reliable pattern behavior.
8. How should stop-loss orders be placed when trading based on patterns?
Effective stop-loss placement for pattern-based trades typically follows these guidelines:
- Head and shoulders: Just above the right shoulder for short positions
- Double tops/bottoms: Beyond the pattern’s intermediate reaction point
- Triangle patterns: On the opposite side of the breakout direction
- Cup and handle: Below the handle’s low point for long positions
- Flag/pennant patterns: Below the flag’s low for bullish flags, above the flag’s high for bearish flags
Generally, stops should be placed at levels that would invalidate the pattern’s expected behavior while accounting for normal market volatility to avoid premature stopouts.
9. What role does volume play in pattern recognition?
Volume serves as a crucial confirmation element in pattern recognition, providing insight into the conviction behind price movements. Ideal volume characteristics include:
- Increasing volume during pattern breakouts
- Decreasing volume during consolidation phases
- Higher volume on trend-confirming moves
- Lower volume on countertrend movements
- Volume spikes at key reversal points
Research indicates that patterns with confirming volume behavior are 60-70% more likely to achieve their projected targets compared to patterns with inconsistent volume.
10. How are price targets determined from technical patterns?
Price targets are typically calculated using these established methods:
- Measured move: Projecting the height of the pattern in the breakout direction
- Fibonacci extensions: Using 127.2%, 161.8%, or 261.8% extensions from pattern dimensions
- Prior support/resistance levels: Identifying historical price reaction points
- Trend line projections: Extending pattern boundary lines
- Wave analysis: Applying wave relationship principles to project future movements
For most classical patterns, the measured move approach (using the pattern’s height) provides a baseline target, with more aggressive targets set using Fibonacci extensions or historical support/resistance levels.
Conclusion
Investment pattern recognition represents the intersection of art and science in financial markets, offering traders a structured methodology for identifying potential price movements before they occur. When implemented correctly, pattern recognition creates a statistical edge that can lead to consistently profitable trading decisions over time. The discipline’s enduring relevance, despite centuries of market evolution, speaks to the unchanging nature of human psychology reflected in price charts.
As we move into an increasingly digital and algorithm-dominated trading landscape, the future of pattern recognition will likely combine traditional technical analysis with artificial intelligence, machine learning, and big data analytics. These technological advancements will not replace human judgment but rather enhance it, allowing traders to identify increasingly complex patterns across multiple dimensions of market data.
For investors willing to develop this skill set, pattern recognition will remain a powerful advantage in navigating financial markets, providing both analytical structure and tactical precision in an otherwise uncertain environment.
For your reference, recently published articles include:
-
- Never Miss A Rally Again: Ultimate Market Signal Detection
- Investment Strategy Validation: Double Your Returns Now!
- Best AI Investment Advisory – Guide To Boost Your Wealth
- AI Investment Advisory Explained – Get Best Advice Here!
- Investment Research Automation: The Way To Your Success
- Global Expense Management Tools – Save Your Time And Money
………………………………………………..
Important Notice: The information in this article is for general and public information purposes only. It solely reflects Didi Somm’s or his Staff’s opinion, and no responsibility can be assumed for errors or omissions in the service’s contents. For details, please check the Disclaimer at the bottom of the homepage.


