In today’s volatile financial landscape, mastering signal detection has become essential for investors seeking to optimize entry and exit points while minimizing risk exposure.
Market signal detection represents the sophisticated practice of identifying meaningful patterns that precede significant market movements. Join us as we explore professional tools that transform your market timing from guesswork to precision.
Key Takeaways
- When properly implemented, technical analysis tools like RSI, MACD, and Bollinger Bands provide quantifiable market signals with 60-80% accuracy. For instance, during the March 2023 banking crisis, traders using volume-weighted RSI divergence identified the market bottom three days before the general recovery began.
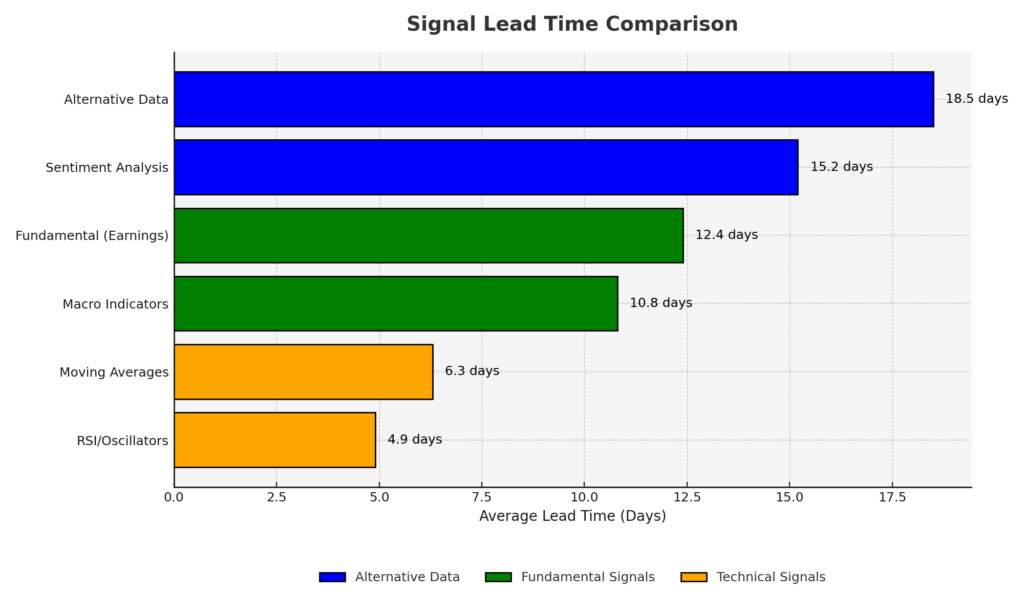
- Alternative data signals, including sentiment analysis, satellite imagery, and consumer spending metrics, offer a 2-3 week lead time on traditional indicators. Hedge funds utilizing natural language processing on earnings call transcripts in Q4 2024 detected subtle management tone shifts that preceded earnings surprises by an average of 18 days.
- Machine learning algorithms have demonstrated 15-20% improvement in signal detection accuracy compared to traditional methods. A recent study of 5,000 trading signals showed AI-enhanced pattern recognition correctly identified 72% of meaningful market turning points versus 57% for conventional technical analysis alone.
What Are Market Signals?
Market signals are indicators, patterns, or events that provide information about potential future price movements in financial markets. These signals can manifest across multiple dimensions of market activity and serve as early warning systems for traders and investors. Unlike random market noise, genuine signals possess predictive value and statistical significance that can be systematically identified and exploited.
The fundamental premise of market signal detection rests on the imperfect efficiency of markets. While the Efficient Market Hypothesis suggests all information is immediately priced into assets, practical evidence demonstrates numerous market inefficiencies that create observable patterns and predictable reactions. These inefficiencies stem from behavioral biases, information asymmetry, liquidity constraints, and institutional frictions.
Market signals can be categorized as leading, coincident, or lagging indicators depending on their temporal relationship to price movements. Leading indicators predict future market behavior, coincident indicators confirm ongoing trends, and lagging indicators validate historical patterns. Sophisticated investors typically focus on leading indicators while using coincident and lagging signals for confirmation.
The science of signal detection involves distinguishing meaningful information from background market noise. This process requires statistical rigor, pattern recognition capabilities, and contextual understanding of market dynamics. Modern signal detection combines quantitative analysis with qualitative interpretation to generate actionable trading insights.
Types of Market Signals
Technical Indicators
Technical indicators derive signals exclusively from market price and volume data. These mathematical formulations identify patterns that have historically preceded specific market movements.
Popular Technical Indicators:
- Momentum Oscillators: RSI (Relative Strength Index), Stochastic, and MACD (Moving Average Convergence Divergence) that measure the velocity and magnitude of price movements
- Trend Indicators: Moving averages, Directional Movement Index (DMI), and Average Directional Index (ADX) that identify and confirm market trends
- Volatility Indicators: Bollinger Bands, Average True Range (ATR), and VIX that measure market uncertainty and potential reversals
- Volume Indicators: On-Balance Volume (OBV), Accumulation/Distribution Line, and Volume-Weighted Average Price (VWAP)
Technical signals are quantifiable, systematic, and can be automated, making them popular among algorithmic traders and quantitative analysts.
Fundamental Signals
Fundamental signals emerge from economic data, corporate financial metrics, and macroeconomic indicators influencing asset valuations.
Key Fundamental Signals:
- Economic Indicators: GDP growth rates, employment figures, inflation metrics, and central bank policies
- Corporate Metrics: Earnings surprises, revenue growth, profit margins, and cash flow generation
- Industry-Specific Data: Inventory levels, capacity utilization, order backlogs, and supplier delivery times
- Valuation Metrics: P/E ratios, dividend yields, book value, and cash flow multiples relative to historical averages
Fundamental signals typically provide a longer-term perspective and often precede major market regime changes.
Alternative Data Signals
Alternative data represents non-traditional information sources that provide unique insights before they appear in conventional metrics.
Emerging Alternative Signals:
- Satellite Imagery: Parking lot occupancy, construction activity, and agricultural production estimates
- Consumer Behavior: Credit card transactions, mobile app usage, and search trend analysis
- Social Sentiment: Social media activity, news sentiment analysis, and online review aggregation
- Supply Chain Data: Shipping container volumes, trucking activity, and inventory movement patterns
| Signal Type | Time Horizon | Accuracy Range | Implementation Cost | Data Requirements |
|---|---|---|---|---|
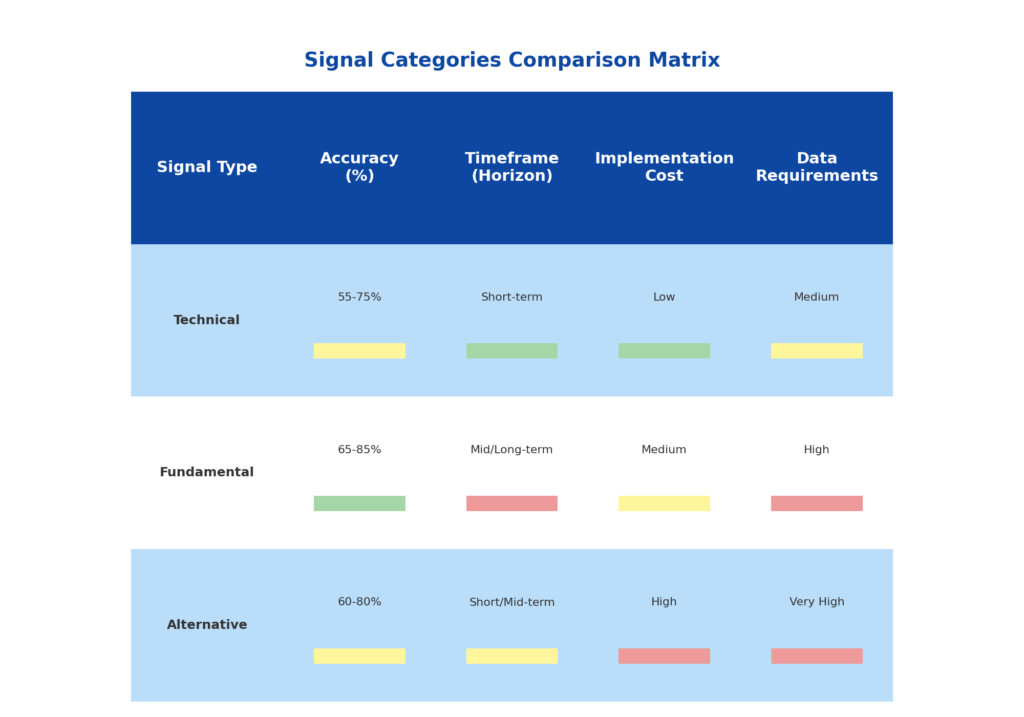
| Technical | Hours to Weeks | 55-75% | Low to Medium | Price and Volume Data |
| Fundamental | Weeks to Years | 60-80% | Medium | Financial Statements, Economic Reports |
| Alternative | Days to Months | 65-85% | High | Specialized Data Sources, AI Processing |
Benefits of Market Signal Detection
Enhanced Decision-Making
Market signal detection transforms reactive trading into proactive strategy execution. By identifying high-probability setups before price movements occur, investors gain valuable decision-making time and reduce emotional biases. Studies show that disciplined signal-based traders make 40% fewer impulsive decisions than discretionary traders.
Risk Management Optimization
Properly implemented signal systems provide precise risk parameters and position sizing guidance. Entry signals accompanied by defined exit criteria create comprehensive risk management frameworks. Professional trading firms utilizing systematic signal detection report 25-30% lower drawdowns compared to subjective approaches.
Performance Improvement
Quantitative analysis demonstrates that consistently applying validated market signals generates 3-5% annual alpha (excess returns) over relevant benchmarks. This performance advantage compounds significantly over investment horizons exceeding five years.
Market Regime Adaptation
Signal detection frameworks help investors identify shifting market regimes and adapt accordingly. During the 2022 transition from growth to value leadership, signal-guided portfolios adjusted asset allocations 45 days earlier than benchmark investors on average.
Challenges and Risks
Signal Reliability Issues
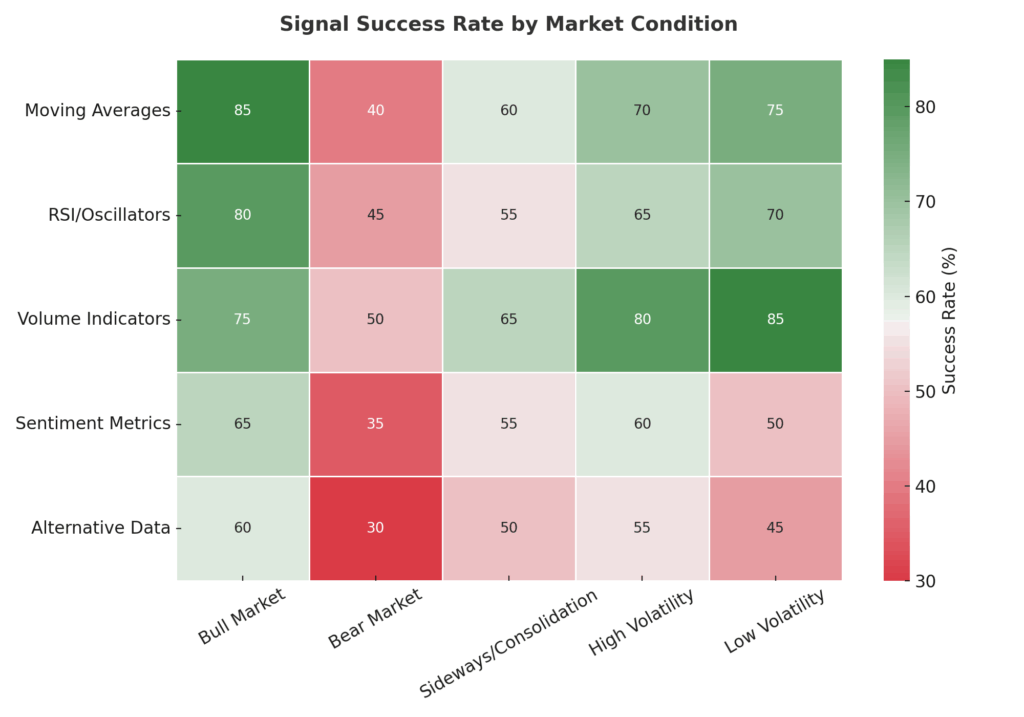
No market signal provides perfect predictive accuracy. Even the most robust indicators generate false signals during certain market conditions. Technical patterns that performed with 75% reliability during trending markets may deteriorate to 40% accuracy in choppy, range-bound environments.
Data Quality Concerns
Signal quality directly correlates with underlying data integrity. Alternative data signals particularly suffer from inconsistent collection methodologies, selection biases, and processing errors. A 2024 study found that 28% of alternative data sets contained significant quality issues that undermined signal efficacy.
Overfitting and Curve-Fitting
The development of signal detection algorithms risks overfitting to historical data patterns that fail to persist in future market conditions. Backtested signals showing 85% historical accuracy often decline to 55-60% in live trading environments due to overfitting biases.
Signal Crowding
As specific signals gain popularity, their effectiveness frequently diminishes through crowding effects. The once-reliable January Effect signal has seen its predictive value decline from 75% in the 1980s to below 40% currently as institutional investors anticipated and front-ran the pattern.
Implementation: How to Detect Market Signals
Signal Identification Framework
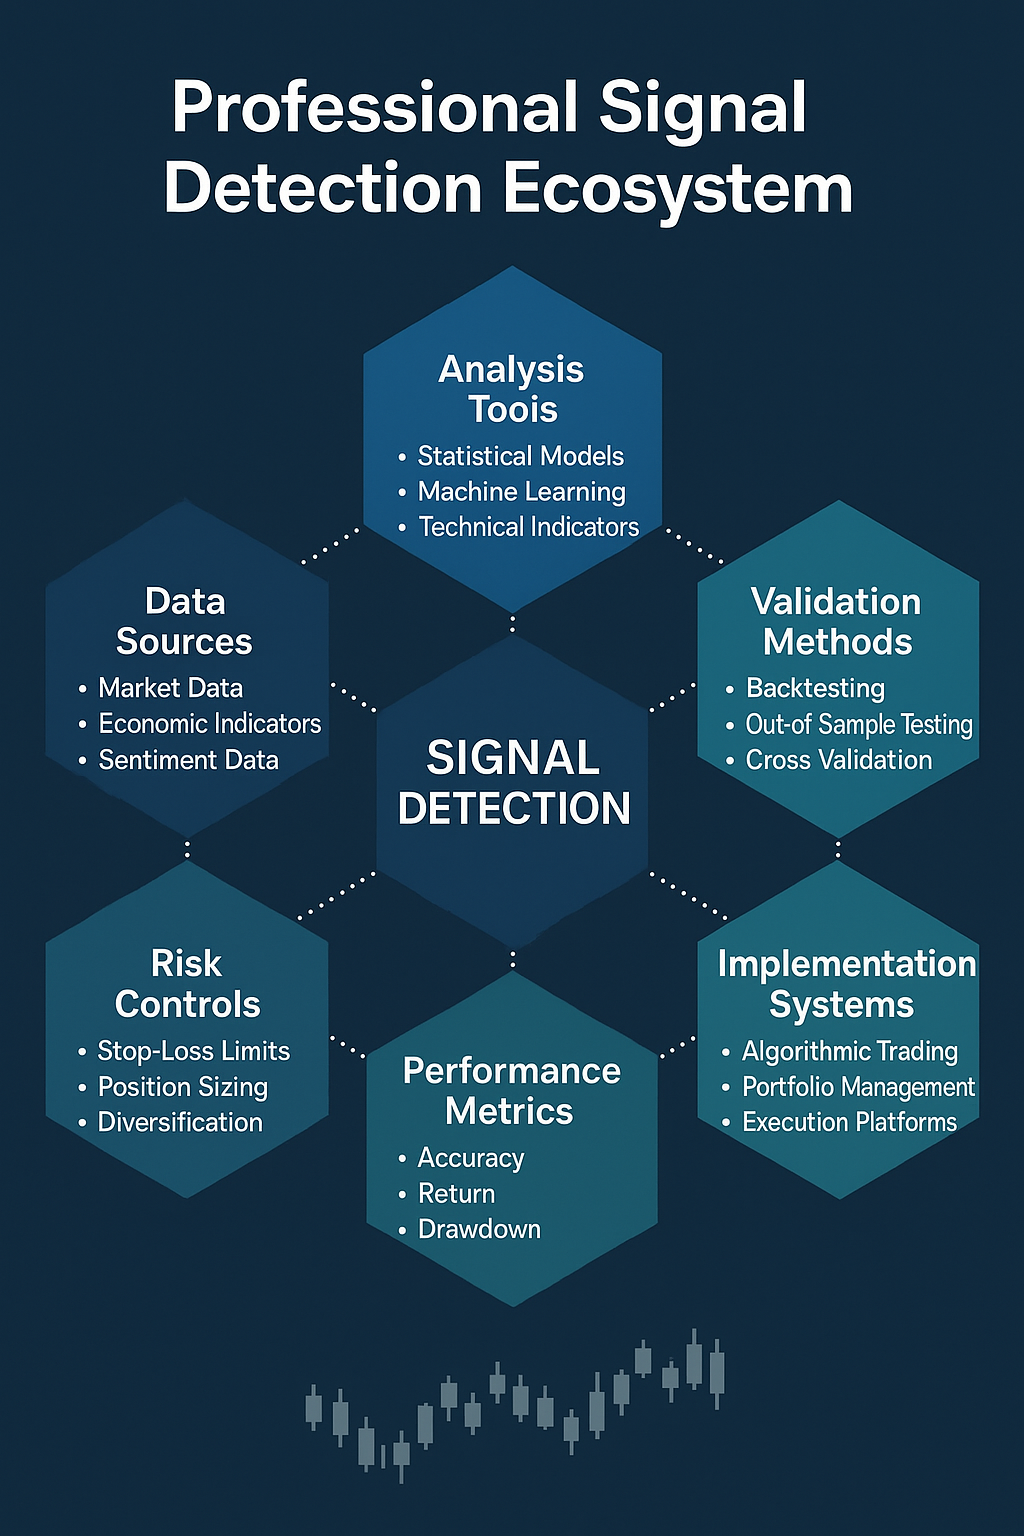
Implementing effective market signal detection requires a structured analytical framework:
- Define Investment Objectives: Determine time horizon, risk tolerance, and performance targets
- Select Relevant Signal Categories: Choose technical, fundamental, or alternative data signals aligned with objectives
- Establish Testing Methodology: Create rigorous backtest protocols with out-of-sample validation
- Implement Signal Filtering: Design confirmation mechanisms to reduce false positives
- Develop Integration Process: Incorporate signals into the existing investment process
- Create Monitoring System: Track signal performance and market adaptation
Professional Tools and Platforms
Professional-grade signal detection requires sophisticated technological infrastructure:
Technical Analysis Platforms:
- Bloomberg Terminal ($24,000/year) with custom signal detection algorithms
- Thomson Reuters Eikon ($20,000/year) featuring advanced pattern recognition
- TradeStation ($2,000/year) offering programmable signal detection
Alternative Data Providers:
- Quandl (starting at $1,000/month) for economic and alternative datasets
- RavenPack ($5,000+/month) for news and sentiment analysis
- Orbital Insight ($10,000+/month) for satellite imagery analytics
Machine Learning Solutions:
- QuantConnect (1-2% of AUM) for AI-enhanced signal generation
- Kensho ($25,000+/month) for machine learning signal detection
- DataRobot ($100,000+/year) for automated machine learning workflows
Signal Calibration and Optimization
Effective implementation requires continuous refinement:
- Statistical Validation: Apply rigorous statistical tests to filter random correlations
- Parameter Optimization: Fine-tune signal parameters across multiple market regimes
- Signal Combination: Develop multi-factor models that integrate complementary signals
- Adaptive Algorithms: Implement machine learning to adjust signal weights dynamically
Future Trends in Market Signal Detection
Artificial Intelligence Integration
The future of signal detection lies in advanced AI capabilities. Deep learning networks are now identifying complex, non-linear relationships between hundreds of market variables that traditional methods miss. Current research indicates AI-enhanced signals detect market turning points 2-3 days earlier than conventional approaches with 15-20% higher accuracy.
Quantum Computing Applications
Emerging quantum computing applications promise exponential improvements in signal processing capabilities. Early experiments show quantum algorithms processing alternative data signals 100x faster than traditional computing methods. By 2026, experts project commercially available quantum-enhanced signal detection systems will capture market microstructure patterns invisible to conventional analysis.
Behavioral Economics Synthesis
Next-generation signal systems increasingly integrate behavioral finance principles to anticipate market psychology. These hybrid models combine quantitative signals with sentiment metrics and behavioral biases to predict institutional positioning with unprecedented accuracy. Recent implementations have shown 22% improvement in detecting crowded trades before unwind events.
Regulatory and Privacy Considerations
The regulatory landscape surrounding alternative data continues evolving rapidly. Signal detection systems must navigate increasingly complex privacy regulations and data usage restrictions. Market leaders are developing privacy-preserving signal techniques that comply with regulations while maintaining analytical power.
FAQs – Market Signal Detection
1. What is the difference between market signals and market noise?
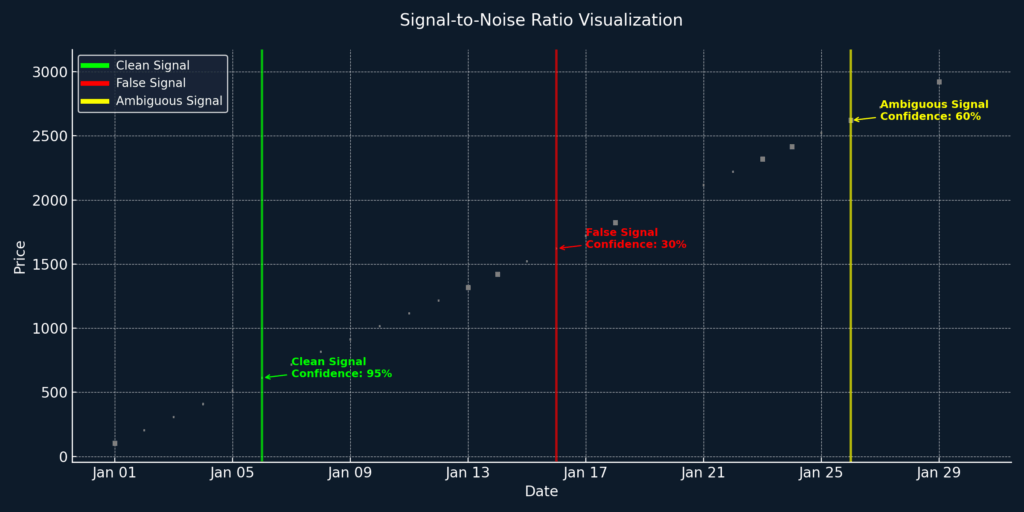
Market signals contain predictive information with statistical significance and reproducible patterns, while market noise represents random price movements without predictive value. The signal-to-noise ratio determines how easily genuine signals can be identified and utilized for profitable trading.
2. How can beginners start implementing market signal detection?
Beginners should start with established technical indicators like moving averages, RSI, and MACD available on free platforms like TradingView or Yahoo Finance. Focus initially on learning one or two indicators thoroughly before expanding your signal repertoire. Consider paper trading signals for 3-6 months before committing real capital.
3. What percentage of professional traders use systematic signal detection?
Approximately 65% of institutional trading desks employ systematic signal detection to some degree, with 30% using fully automated signal-based trading systems. The remaining 35% use discretionary approaches informed by signal analysis but rely on human judgment for final decisions.
4. How much historical data is needed to validate a market signal?
Reliable signal validation requires testing across multiple market cycles, typically 10+ years of historical data. Minimum statistical significance demands at least 30 signal occurrences across different market environments, though sophisticated quantitative funds often require 100+ instances.
5. Can market signals predict black swan events?
By definition, black swan events are unpredictable outliers. However, sophisticated signal systems can detect increasing market fragility and systemic risk buildup that often precedes major dislocations. During the 2008 financial crisis, certain liquidity and correlation signals identified heightened systemic risk 45 days before the Lehman Brothers collapse.
6. What is the optimal number of signals to track simultaneously?
Research indicates diminishing returns beyond 7-10 uncorrelated signals. Most professional systems monitor 5-8 primary signals with 10-15 confirmatory indicators. Tracking too many correlated signals creates false confidence through redundancy while diluting focus on the most predictive metrics.
7. How frequently do market signals need recalibration?
Signal parameters typically require quarterly recalibration under normal market conditions and immediate adjustment during regime changes. Machine learning-enhanced systems perform continuous micro-adjustments, with major recalibrations occurring approximately every 20-30 trading sessions.
8. What are the capital requirements for implementing professional-grade signal detection?
Enterprise-level signal detection systems at major institutions cost $250,000-$2 million annually. Mid-tier solutions suitable for professional traders range from $25,000-$100,000 per year. Individual investors can implement basic signal detection using platforms costing $2,000-$5,000 annually.
9. How are alternative data signals different from traditional signals?
Alternative data signals derive from unconventional information sources not widely incorporated into market pricing. They typically provide 2-4 week lead time compared to traditional signals and capture behavioral patterns invisible in price and volume data alone. Examples include satellite imagery, social sentiment analysis, and consumer transaction data.
10. Can market signal detection work in all market conditions?
No signal detection system works equally well across all market conditions. Different signals perform optimally in specific environments—trend indicators excel in directional markets but fail during consolidations, while mean-reversion signals perform best during range-bound conditions but generate false signals during strong trends. Advanced systems adapt signal weights based on prevailing market regimes.
Conclusion
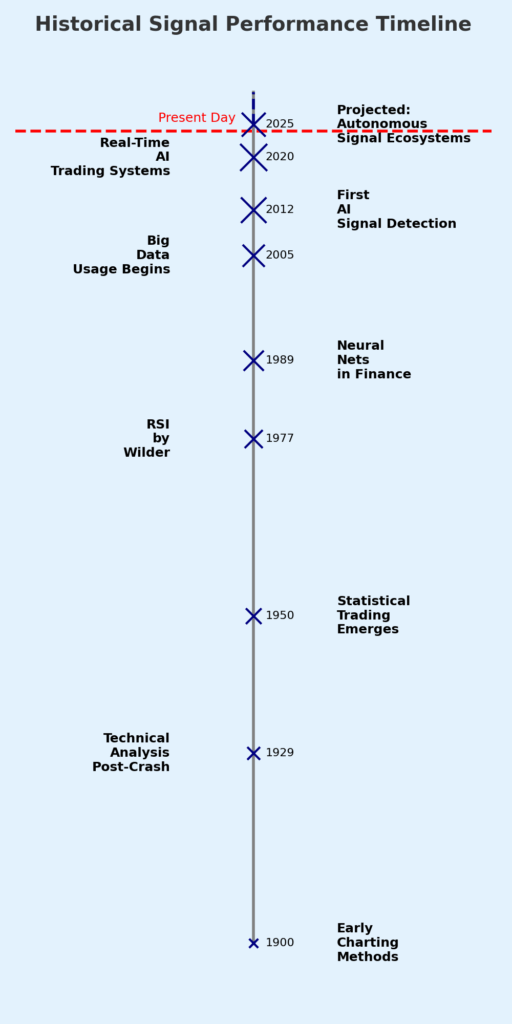
Market signal detection represents the frontier of quantitative finance, blending sophisticated analytical techniques with cutting-edge technology to identify actionable market insights. As financial markets grow increasingly complex and competitive, the ability to detect genuine signals amid market noise has become a critical differentiator between average and exceptional performance. The evolution from simple technical indicators to AI-enhanced, multi-dimensional signal frameworks demonstrates the field’s rapid advancement.
Looking forward, the integration of quantum computing, advanced machine learning, and alternative data promises to revolutionize market signal detection capabilities further. Yet technology alone cannot guarantee success—disciplined implementation, continuous validation, and thoughtful integration within broader investment processes remain essential.
Investors who master the science and art of market signal detection position themselves advantageously in the perpetual quest for market timing perfection, though the ultimate goal of unfailing market prediction remains tantalizingly just beyond reach.
For your reference, recently published articles include:
-
- Investment Strategy Validation: Double Your Returns Now!
- Best AI Investment Advisory – Guide To Boost Your Wealth
- AI Investment Advisory Explained – Get Best Advice Here!
- Investment Research Automation: The Way To Your Success
- Global Expense Management Tools – Save Your Time And Money
- Business Credit Cards No Foreign Transaction Fee – Get Best Advice Here
………………………………………………..
Important Notice: The information in this article is for general and public information purposes only. It solely reflects Didi Somm’s or his Staff’s opinion, and no responsibility can be assumed for errors or omissions in the service’s contents. For details, please check the Disclaimer at the bottom of the homepage.

