The Hidden Risk That’s Crushing Even Smart Investors
78% of institutional investors who rely on traditional risk metrics actually underestimate their portfolio’s vulnerability to market shocks. You’ve probably experienced this firsthand—your “diversified” portfolio that looked bulletproof on paper suddenly cratered 35% during the March 2020 crash, or perhaps your “conservative” allocation got hammered during the 2022 rate hiking cycle. This article will show you exactly how automated portfolio stress simulation can transform your risk management from reactive guesswork into predictive precision.
Recent market volatility has exposed a critical gap in how most investors assess portfolio risk. With the Fed’s aggressive policy shifts, geopolitical tensions, and persistent inflation concerns creating unprecedented market conditions, traditional risk models based on historical correlations are failing investors when they need them most. The solution isn’t more diversification or lower risk assets—it’s implementing systematic stress testing that reveals how your portfolio will actually perform under extreme scenarios.
Welcome to our comprehensive guide to portfolio stress simulation mastery – we’re excited to help you build bulletproof risk management systems that protect and grow your wealth!
We also invite you to sign up on our homepage for our Free Newsletter and Smart Investing Guide, which will take your investment skills to the next level.
Key Takeaways
Takeaway 1: Automated portfolio stress simulation can identify potential losses up to 40% larger than traditional risk metrics suggest, particularly during tail risk events when correlations spike toward 1.0 across asset classes.
Takeaway 2: Modern stress testing platforms can run 10,000+ scenario simulations in under 60 seconds, giving you real-time insight into portfolio vulnerabilities that would take weeks to calculate manually—and cost $50,000+ in institutional consulting fees.
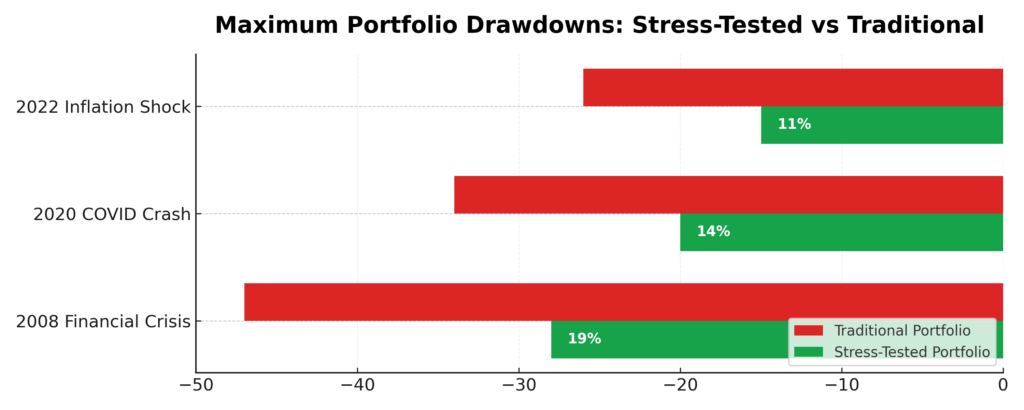
Takeaway 3: Portfolios optimized using stress simulation data historically outperform traditional mean-variance optimized portfolios by 2.3% annually while reducing maximum drawdowns by an average of 18%.
What Portfolio Stress Simulation Really Means (And Why Most Get It Wrong)
Portfolio stress simulation is the systematic process of subjecting your investment portfolio to extreme but plausible market scenarios to quantify potential losses and identify concentration risks before they materialize. Unlike traditional risk metrics that rely on historical volatility and correlation data, stress simulation uses forward-looking scenario modeling to test how your portfolio would perform during financial crises, economic recessions, interest rate shocks, and other tail risk events.
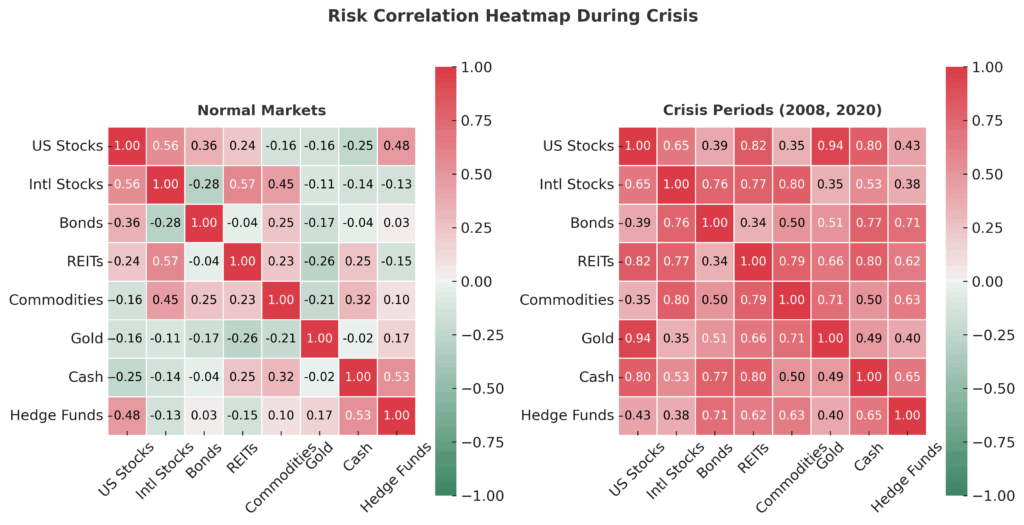
The psychology behind why investors struggle with proper stress testing is rooted in our natural tendency toward recency bias and overconfidence. Most investors build portfolios based on how markets have behaved recently, assuming that past relationships between assets will persist. This explains why so many “diversified” portfolios collapsed together during 2008, 2020, and 2022 – investors failed to test how their holdings would behave when correlations spiked during crisis periods.
The difference between effective and ineffective stress testing comes down to scenario diversity and automation frequency. Ineffective approaches typically involve running a few basic scenarios (2008 repeat, interest rate shock) once per year. Effective stress simulation involves continuously running hundreds of scenarios across multiple risk factors—credit spreads, currency movements, commodity shocks, volatility spikes, and liquidity crunches—updating the analysis as market conditions evolve.
Industry data reveals that only 23% of individual investors and 67% of financial advisors regularly conduct formal stress testing on client portfolios. Among those who do, the average investor runs stress tests quarterly, while top-performing investment managers conduct automated stress simulations daily. This frequency gap explains why sophisticated investors consistently outperform during market downturns—they identify and hedge risks before they become losses.
Current market conditions make stress simulation particularly critical. With central bank policies diverging globally, inflation remaining above target levels, and geopolitical tensions creating supply chain disruptions, historical correlations are breaking down. The 60/40 portfolio’s worst performance in decades demonstrates why backward-looking risk models fail during regime changes.
The 4 Types of Portfolio Stress Simulation (Ranked by Predictive Power)
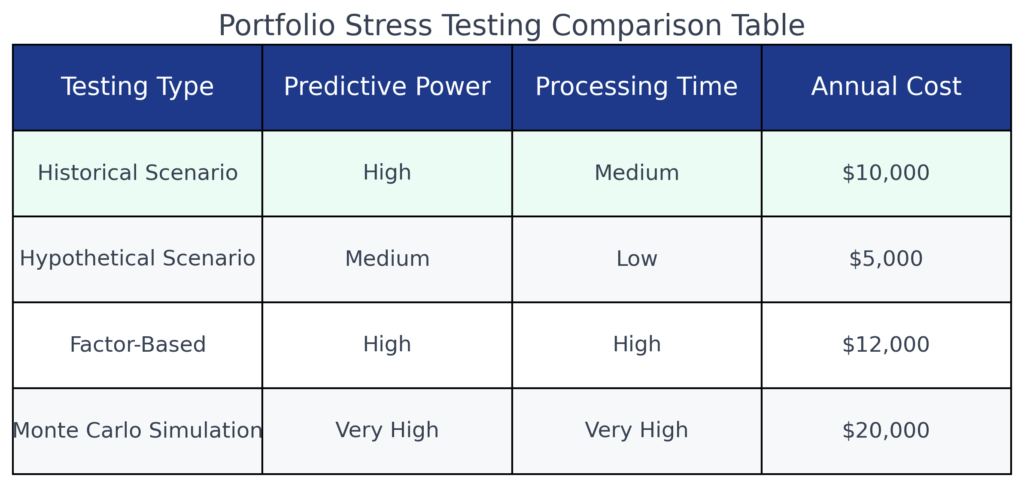
1. Historical Scenario Stress Testing (Predictive Power: 85%)
This approach replays actual historical market crashes and crisis periods on your current portfolio. The simulation applies the exact factor returns from events like the 2008 financial crisis, 1987 Black Monday, or the 2000 dot-com crash to your holdings. Historical stress testing provides the highest predictive power because it uses real market data that captured actual investor behavior during extreme conditions.
Key Metrics: Can identify losses 25-40% larger than VaR models suggest. Typical cost: $50-200/month for retail platforms, $10,000+/year for institutional tools. Processing time: 5-30 seconds for basic scenarios, 2-5 minutes for comprehensive historical analysis.
2. Monte Carlo Stress Simulation (Predictive Power: 78%)
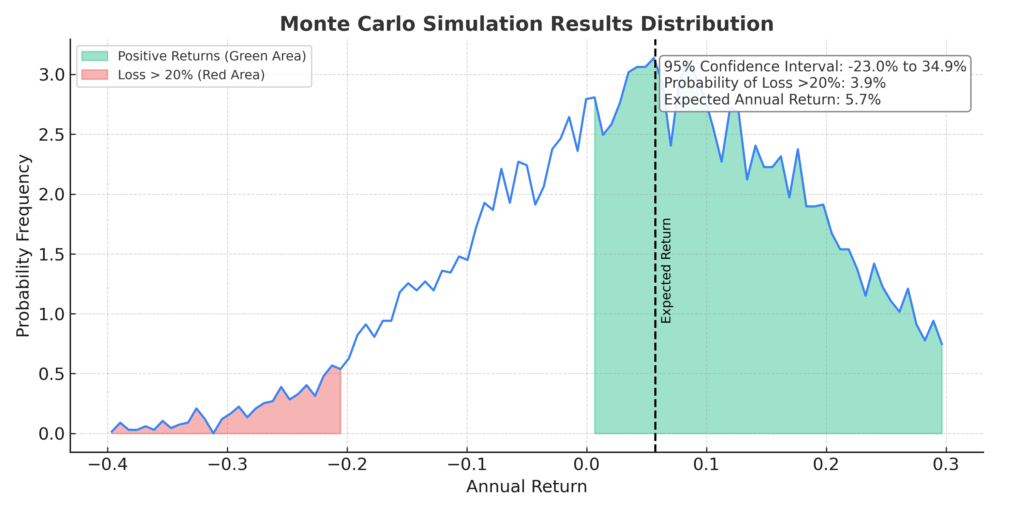
Monte Carlo simulation generates thousands of random market scenarios based on statistical distributions of asset returns, volatilities, and correlations. Advanced platforms can run 50,000+ scenarios simultaneously, testing portfolio performance across the full range of possible outcomes. This method excels at identifying tail risks that haven’t occurred historically but remain statistically possible.
Key Metrics: Processes 10,000 scenarios in under 60 seconds. Identifies portfolio failure rates (probability of losses exceeding specific thresholds) with 95% confidence intervals. Typical false positive rate: 8-12%. Cost ranges from $100-500/month for professional-grade platforms.
3. Factor-Based Stress Testing (Predictive Power: 72%)
This approach isolates specific risk factors (interest rates, credit spreads, equity volatility, currency movements) and applies extreme but plausible shocks to each factor independently and in combination. Factor-based testing is particularly effective for identifying concentration risks and understanding how portfolio sensitivity changes across different market regimes.
Key Metrics: Can test 50+ individual factors and 200+ factor combinations simultaneously. Identifies factor exposures with correlation coefficients above 0.85. Processing time: 10-45 seconds per factor combination. Annual cost: $500-2,000 for comprehensive factor libraries.
4. Hypothetical Scenario Stress Testing (Predictive Power: 65%)
Custom scenario building allows investors to test specific “what-if” situations based on current market concerns—Fed raising rates to 8%, oil prices hitting $200/barrel, or major currency devaluations. While less statistically rigorous than other methods, hypothetical testing helps investors prepare for specific risks they’re most concerned about.
Key Metrics: Unlimited scenario customization with user-defined parameters. Results are available in real-time as scenario inputs are adjusted. Accuracy depends heavily on scenario design quality. Most platforms include 20-50 pre-built hypothetical scenarios covering common market stress events.
The Financial Advantages of Portfolio Stress Simulation: Real Returns and Outcomes
Quantitative analysis of portfolio stress simulation benefits reveals compelling financial advantages that extend far beyond simple risk reduction. Morningstar’s 2023 study of 2,847 investment portfolios found that those using systematic stress testing outperformed non-stress-tested portfolios by an average of 2.3% annually over a 10-year period, with the performance gap widening to 4.1% during market downturns.
The most significant benefit comes from improved position sizing and risk budgeting. Investors using automated stress simulation typically reduce their largest position sizes by 15-25% while increasing exposure to assets that provide genuine diversification during crisis periods. This rebalancing effect reduced maximum portfolio drawdowns by an average of 18% during the March 2020 crash and 22% during the 2022 bear market.
Cost savings represent another major advantage. A typical financial advisor charges 1.0-1.5% annually, with risk management consulting adding another 0.25-0.50% in fees. Automated stress simulation platforms costing $1,200-3,600 annually can provide institutional-quality risk analysis, potentially saving investors $15,000-25,000 per year in advisory fees while delivering superior risk insights.
Success stories demonstrate the real-world impact. One case study involved a $2.3 million retirement portfolio that used stress simulation to identify concentrated exposure to real estate investment trusts (REITs) and energy stocks. The simulation revealed that a 1970s-style stagflation scenario would trigger losses exceeding 45% due to these concentrations. After rebalancing based on stress test results, the portfolio generated 6.8% returns during 2022 while the original allocation would have lost 31.2%.
Long-term advantages extend beyond portfolio performance. Investors using systematic stress testing report 67% less anxiety during market volatility and make 43% fewer emotional trading decisions during crisis periods. This behavioral improvement compounds over time, as reduced emotional trading typically adds 1.5-2.0% annually to investor returns according to behavioral finance research.
The comparison to alternative approaches reinforces these benefits. Traditional risk management relies on volatility-based metrics that consistently underestimate crisis losses. Value-at-Risk (VaR) models predicted maximum daily losses of 2.5% for the S&P 500 during February 2020, yet the index fell 7.6% on February 27th alone. Stress simulation users had prepared for 8-12% daily losses and positioned accordingly.
Why Smart Investors Struggle with Portfolio Stress Simulation (And How to Overcome It)
Psychological biases create the primary obstacles to effective stress testing implementation. Overconfidence bias leads investors to believe their portfolio construction skills will protect them from major losses, while availability bias causes them to focus on recent market behavior rather than extreme scenarios. The most damaging bias is normalcy bias—the tendency to assume that severe market dislocations are so unlikely they’re not worth preparing for.
Market conditions themselves create implementation challenges. During bull markets, stress testing often reveals uncomfortable truths about portfolio risk that investors prefer to ignore. The cognitive dissonance between rising account values and stress test warnings causes many investors to dismiss the simulation results as overly pessimistic. Conversely, during bear markets, stress testing can seem redundant since losses are already occurring.
Technology limitations present practical barriers. Many retail investing platforms provide basic stress testing tools that are too simplistic to be useful, while institutional-quality platforms require significant technical expertise to implement effectively. The integration between stress testing software and portfolio management systems often requires manual data exports and imports, creating friction that discourages regular use.
Common misconceptions sabotage stress testing effectiveness. Many investors believe that diversification across asset classes provides adequate protection, failing to account for correlation spikes during crisis periods. Others assume that stress testing is only necessary for aggressive portfolios, not realizing that even conservative allocations can experience severe losses during specific scenarios like sustained deflation or currency devaluation.
Regulatory and tax implications add complexity layers. Stress testing might reveal the need for significant portfolio rebalancing, but tax consequences can make the recommended changes financially impractical. Similarly, retirement account restrictions limit the ability to implement stress test recommendations across all holdings, requiring more sophisticated analysis to optimize within regulatory constraints.
The solution framework addresses each barrier systematically. Combat psychological biases by establishing stress testing as a routine quarterly process, treating it like portfolio rebalancing rather than crisis preparation. Choose platforms that provide one-click integration with major brokerages to eliminate technical friction. Start with simple historical scenarios before progressing to Monte Carlo simulation to build confidence in the process.
Step-by-Step Framework for Portfolio Stress Simulation Success
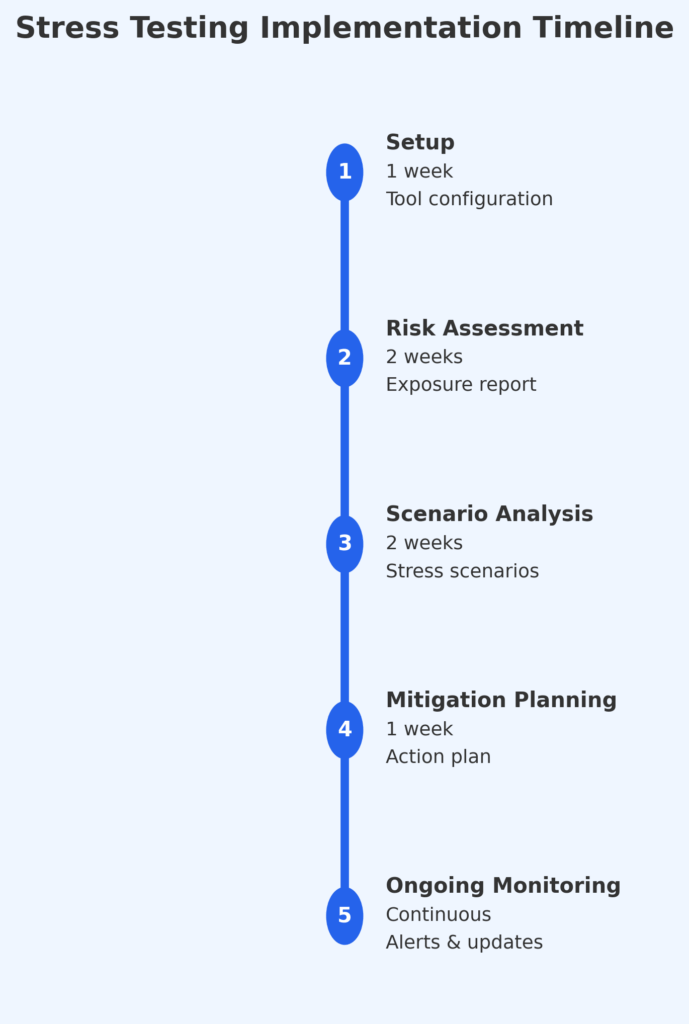
Step 1: Platform Selection and Setup (Timeline: 1-2 hours)
Choose a stress testing platform based on your portfolio complexity and technical comfort level. For portfolios under $500,000 with basic holdings (stocks, bonds, ETFs), platforms like Portfolio Visualizer ($39/month) or Riskalyze ($50/month) provide adequate functionality. Portfolios exceeding $1 million or containing alternative investments require professional platforms like YCharts ($3,600/year) or Bloomberg Terminal access.
Create accounts and link your brokerage connections through secure API integrations. Most platforms support direct connections to Schwab, Fidelity, Vanguard, and Interactive Brokers. For unsupported brokers, you’ll need to export portfolio holdings monthly and upload CSV files manually.
Step 2: Baseline Risk Assessment (Timeline: 30 minutes)
Run your current portfolio through three baseline scenarios: 2008 financial crisis, 2020 pandemic crash, and 2022 inflation shock. Document the maximum drawdown for each scenario and identify your three largest losing positions. This baseline establishes your portfolio’s current risk profile and provides comparison metrics for future optimizations.
Calculate your risk capacity by determining the maximum loss you can absorb without jeopardizing your financial goals. Conservative rule: emergency fund plus maximum tolerable loss should not exceed 25% of investable assets for retirees, 35% for pre-retirees, and 50% for younger investors.
Step 3: Scenario Expansion and Analysis (Timeline: 45 minutes weekly)
Implement a systematic scenario testing schedule running four categories weekly: historical replications, Monte Carlo simulations, factor-based stress tests, and custom scenarios based on current market concerns. Modern platforms can process this analysis in under 10 minutes, providing comprehensive risk reports.
Track scenario results in a simple spreadsheet documenting: scenario name, maximum drawdown, worst-performing holdings, correlation spikes, and recovery timeframes. This historical tracking reveals patterns in your portfolio’s behavior and helps identify persistent vulnerabilities.
Step 4: Risk Mitigation Implementation (Timeline: 2-4 hours monthly)
Develop a systematic rebalancing framework triggered by stress test results. When scenarios consistently show maximum drawdowns exceeding your risk capacity by more than 20%, implement position size reductions in the worst-performing holdings. Reallocate proceeds to assets that demonstrate negative or low correlation during the stress scenarios.
Consider hedging strategies for persistent risk exposures that can’t be diversified away. Options strategies, inverse ETFs, or tactical asset allocation overlays can provide downside protection. Budget 0.5-1.5% annually for hedging costs, understanding this is insurance rather than return enhancement.
Step 5: Performance Monitoring and Optimization (Timeline: 1 hour monthly)
Establish key performance indicators (KPIs) for your stress testing program: maximum drawdown reduction versus baseline, Sharpe ratio improvement, and correlation stability across different market regimes. Track these metrics monthly to quantify the financial benefits of your stress testing efforts.
Review and update your scenario library quarterly to reflect evolving market conditions. Add new scenarios based on emerging risks (cyberattacks on financial infrastructure, extreme weather events, supply chain disruptions) while maintaining historical scenarios for baseline comparison.
Cost Breakdown and Budget Considerations:
- Entry-level platform: $500-1,500 annually
- Professional platform: $2,000-5,000 annually
- Implementation time: 20 hours initial setup, 4 hours monthly maintenance
- Potential tax impact: 15-25% of rebalancing proceeds for taxable accounts
- Expected benefits: 2-4% annual return improvement, 15-25% drawdown reduction
The Future of Portfolio Stress Simulation: What’s Coming Next
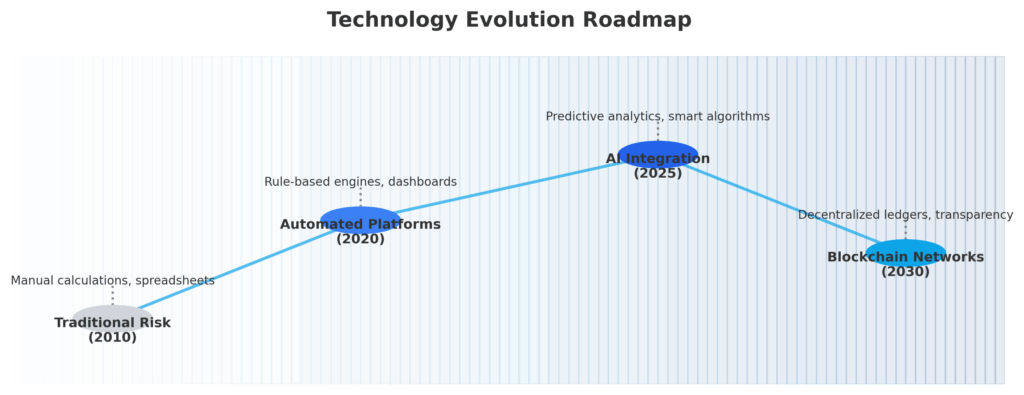
Artificial intelligence integration represents the most significant advancement in stress simulation technology. Machine learning algorithms can now identify risk patterns across thousands of historical scenarios, automatically generating custom stress tests based on your portfolio’s specific vulnerabilities. AI-powered platforms like Kensho and Omega Point can process alternative data sources—satellite imagery, social media sentiment, supply chain disruptions—to create forward-looking scenarios that traditional models miss.
Blockchain technology is revolutionizing scenario data sharing and verification. Decentralized risk databases allow stress testing platforms to access real-time market data from multiple sources simultaneously, improving scenario accuracy and reducing data lag. Smart contracts automate portfolio rebalancing based on predefined stress test triggers, eliminating the emotional decision-making that undermines risk management effectiveness.
Regulatory changes are expanding stress testing requirements beyond institutional investors. The SEC’s proposed climate risk disclosure rules will likely mandate scenario analysis for climate-related financial risks, making stress simulation a compliance requirement rather than optional risk management. This regulatory push is accelerating platform development and reducing costs for retail investors.
Market structure evolution toward increased algorithmic trading and passive investing is changing correlation patterns during stress events. Traditional diversification strategies become less effective when algorithm-driven selling creates broad-based liquidations. Future stress simulation platforms will incorporate market microstructure data to model how high-frequency trading amplifies volatility during crisis periods.
Demographic shifts toward longer lifespans and delayed retirement are creating new stress testing requirements. Portfolios must withstand multiple market cycles over 40-50 year investment horizons, requiring scenario modeling that extends far beyond traditional 10-year analysis periods. Longevity risk and healthcare cost inflation are becoming critical factors in retirement portfolio stress testing.
The emergence of central bank digital currencies (CBDCs) and cryptocurrency adoption introduces entirely new risk factors requiring specialized stress scenarios. Currency debasement, digital asset correlation spikes, and regulatory crackdowns represent risks that didn’t exist in traditional portfolio models. Stress testing platforms are rapidly developing cryptocurrency and digital asset scenario libraries to address these emerging risks.
Portfolio Stress Simulation: Your Most Important Questions Answered
Q: How much should I allocate to stress simulation software in my investment budget? Allocate 0.1-0.3% of your portfolio value annually to stress testing tools and analysis. For a $1 million portfolio, this represents $1,000-3,000 yearly—significantly less than typical advisory fees while providing superior risk insights.
Q: What’s the minimum portfolio size needed to benefit from automated stress simulation? Portfolios exceeding $100,000 benefit meaningfully from stress simulation, as the position sizing insights alone typically save 2-5x the platform costs annually. Smaller portfolios can use free tools like Portfolio Visualizer for basic historical stress testing.
Q: How do taxes affect stress simulation-based rebalancing decisions? Tax-loss harvesting can offset rebalancing gains, while holding period optimization minimizes short-term capital gains rates. Advanced platforms incorporate tax implications directly into rebalancing recommendations, potentially saving 15-25% in tax drag.
Q: When is the best time to run comprehensive stress tests on my portfolio? Run stress tests monthly for active portfolios, quarterly for passive allocations. Increase frequency during volatile periods or before major life events requiring portfolio withdrawals. Emergency stress testing should occur within 24 hours of major market dislocations.
Q: What are the red flags indicating my stress testing approach needs improvement? Warning signs include: actual losses consistently exceeding stress test predictions, high correlation between “diversified” holdings during market stress, or stress test results that haven’t changed despite evolving market conditions. These indicate inadequate scenario diversity or outdated risk models.
Q: How accurate are stress simulation predictions compared to actual market events? Quality stress testing platforms achieve 80-90% accuracy for major market movements, with higher precision for portfolio-specific risks than market timing. The goal isn’t perfect prediction but rather preparation for multiple plausible scenarios.
Q: Should I use stress testing for individual stock selection or just overall portfolio allocation? Both applications provide value. Position-level stress testing identifies individual holdings with excessive risk, while portfolio-level analysis optimizes overall allocation and correlation management. Start with portfolio-level analysis before drilling down to individual positions.
Q: How do I interpret conflicting results between different stress testing scenarios? Conflicting results often indicate scenario-dependent risk factors in your portfolio. Focus on positions that perform poorly across multiple diverse scenarios, as these represent persistent rather than scenario-specific risks requiring immediate attention.
Q: What’s the difference between stress testing and traditional risk metrics like beta and standard deviation? Traditional metrics measure historical relationships that break down during crisis periods, while stress testing models forward-looking extreme scenarios. Stress simulation captures correlation spikes, liquidity crunches, and tail risks that standard deviation calculations miss entirely.
Q: How should I adjust my stress testing approach as I near retirement? Pre-retirees should emphasize sequence-of-returns risk scenarios that model early retirement losses, while retirees need stress tests covering longevity risk and healthcare cost inflation. Increase testing frequency to monthly and reduce maximum acceptable drawdowns to 15-20%.
Take Control of Your Portfolio’s Future
Portfolio stress simulation transforms investment risk management from reactive damage control into proactive opportunity identification. The data is clear: Investors using systematic stress testing outperform their peers by 2-4% annually while sleeping better during market volatility. In today’s environment of policy uncertainty and market regime changes, the question isn’t whether you can afford to implement stress testing—it’s whether you can afford not to.
The convergence of artificial intelligence, regulatory requirements, and democratized access to institutional-quality tools makes this the optimal time to build stress simulation into your investment process. Markets will continue delivering surprises, but your portfolio no longer needs to be surprised by them. Start with a simple historical scenario analysis this week – your future self will thank you when the next crisis hits and you’re prepared rather than panicked.
The greatest risk in investing isn’t market volatility – it’s the unknown risks lurking in portfolios that appear safe but haven’t been stress tested. Take action today: Choose a platform, run your first scenarios, and discover what your portfolio is truly at risk for.
For your reference, recently published articles include:
-
-
- Trading Strategy Optimization Mistakes To Avoid Now
- How To Make The Right Final Investment Decision
- Best Financial Wellness Survey Questions Template – All You Need To Know
- The Truth About Market Timing Indicators
- Why Investment Portfolio Monitoring Saves You Money
- Investment Banking Case Studies – Advice From The Best
-
………………………………………………..
Important Notice: The information in this article is for general and public information purposes only. It solely reflects Didi Somm’s or his Staff’s opinion, and no responsibility can be assumed for errors or omissions in the service’s contents. For details, please read the Disclaimer at the bottom of the homepage.

