Trading strategy optimization represents the systematic process of refining and improving trading methodologies to maximize returns while minimizing risks.
In today’s volatile financial markets, where algorithmic trading accounts for approximately 70% of all equity transactions, avoiding common optimization pitfalls has become crucial for both institutional and retail traders. The difference between successful and failed trading strategies often lies not in the initial approach, but in how effectively traders navigate the optimization process without falling into well-documented traps.
Welcome to our comprehensive guide on trading strategy optimization mistakes – we’re excited to help you master these critical optimization techniques and avoid costly pitfalls!
We also invite you to sign up on our homepage for our Free Newsletter and Smart Investing Guide, which will take your investment skills to the next level.
Key Takeaways
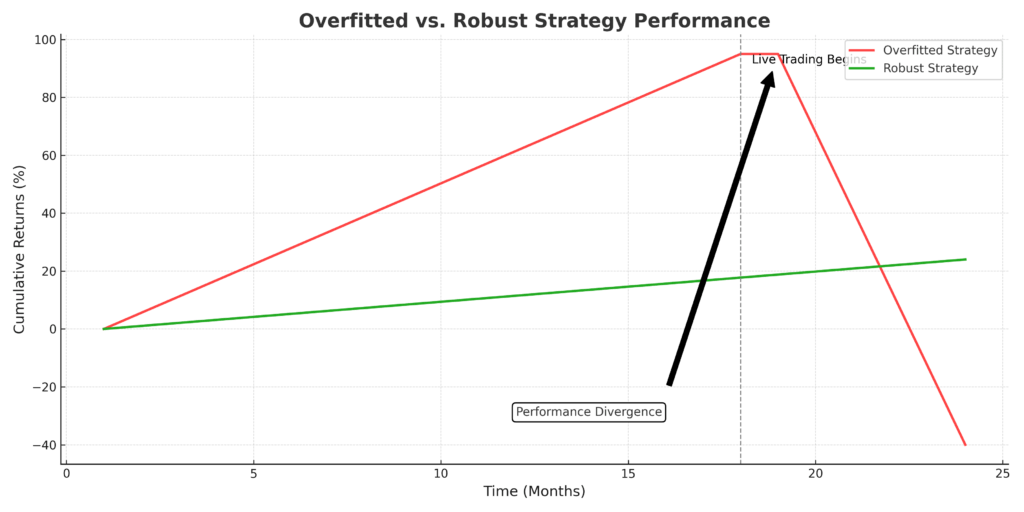
1. Over-optimization leads to curve-fitting disasters: Traders who optimize their strategies using excessive historical data points often create systems that perform exceptionally well on past data but fail catastrophically in live markets. For example, a day trading strategy optimized with 500+ variables might show 95% accuracy in backtests but lose 40% of capital within the first month of live trading due to market regime changes.
2. Inadequate sample sizes produce misleading results: Strategies tested on insufficient data samples yield statistically insignificant results that cannot reliably predict future performance. A momentum strategy tested on only six months of data during a bull market may show 60% returns, but this same strategy could experience devastating losses during market corrections if not validated across multiple market cycles spanning at least 3-5 years.
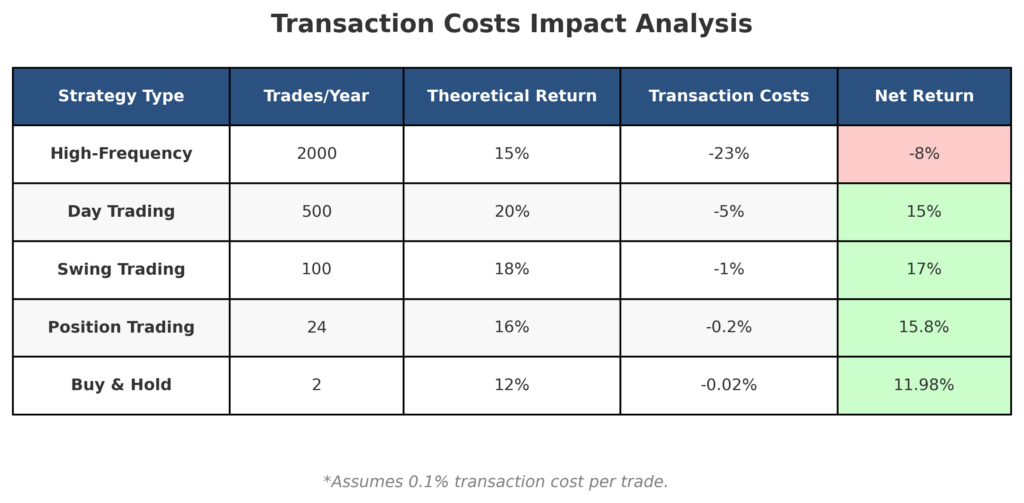
3. Ignoring transaction costs destroys profitability: Many traders optimize strategies based on theoretical returns without accounting for real-world trading costs, including spreads, commissions, and slippage. A high-frequency strategy showing 15% annual returns in backtests might actually lose 8% annually when accounting for 0.1% transaction costs per trade across 2,000 trades per year.
Understanding Trading Strategy Optimization
Trading strategy optimization encompasses the methodical enhancement of trading rules, parameters, and risk management protocols to achieve superior risk-adjusted returns. This process involves analyzing historical market data, identifying profitable patterns, and calibrating strategy components to maximize performance metrics such as the Sharpe ratio, maximum drawdown, and profit factor.
The optimization process typically begins with strategy conceptualization, where traders develop hypotheses about market behavior based on fundamental or technical analysis principles. These hypotheses evolve into testable trading rules incorporating entry signals, exit criteria, position sizing algorithms, and risk management parameters. The subsequent backtesting phase applies these rules to historical data to evaluate potential performance.
Modern optimization techniques utilize sophisticated mathematical models and machine learning algorithms to explore vast parameter spaces efficiently. Walk-forward analysis, Monte Carlo simulations, and genetic algorithms represent advanced methodologies that help traders identify robust parameter combinations while avoiding overfitting. These techniques enable systematic evaluation of thousands of parameter combinations across multiple market conditions.
The integration of out-of-sample testing ensures that optimized strategies maintain performance consistency beyond the optimization period. This approach involves reserving portions of historical data for validation purposes, creating more realistic performance expectations. Additionally, paper trading and forward testing provide real-time validation before committing actual capital.
However, the optimization landscape presents numerous pitfalls that can transform promising strategies into costly failures. Understanding these common mistakes enables traders to develop more robust, profitable trading systems that withstand various market conditions and maintain long-term viability.
Types and Categories of Optimization Mistakes
Data-Related Errors
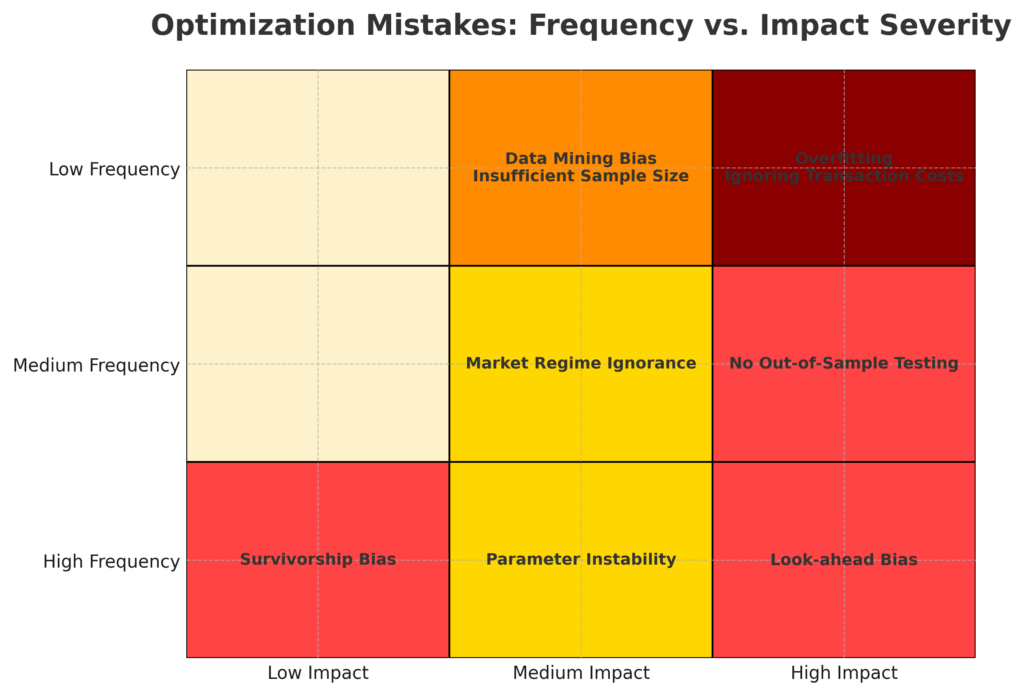
Look-ahead bias occurs when optimization processes inadvertently use future information not available at the time of historical trades. This mistake artificially inflates backtest performance by incorporating knowledge of subsequent price movements, creating unrealistic expectations for live trading performance.
Survivorship bias emerges when optimization datasets exclude delisted or bankrupt securities, presenting an overly optimistic view of market opportunities. Strategies optimized on surviving stocks may show exceptional returns but fail when applied to the complete universe of tradeable securities.
Data mining bias results from excessive parameter testing without proper statistical validation. Traders who test hundreds of parameter combinations often discover seemingly profitable configurations that represent random statistical anomalies rather than genuine market insights.
Methodological Mistakes
Overfitting represents the most prevalent optimization error, where strategies become excessively tailored to historical data patterns. These over-optimized systems demonstrate excellent backtest performance but lack the generalization ability necessary for profitable live trading.
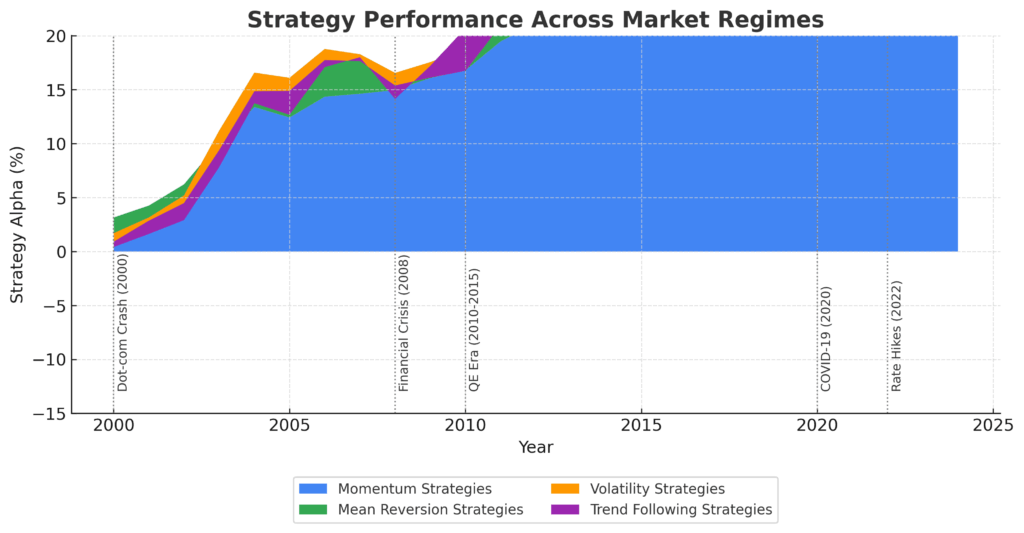
Insufficient diversification occurs when optimization focuses on narrow market segments or time periods. Strategies optimized exclusively during trending markets may fail during consolidation phases, while sector-specific optimizations may collapse during industry rotations.
Parameter instability emerges when small parameter changes produce dramatically different results. Robust strategies should maintain reasonable performance across parameter ranges, indicating genuine market edge rather than statistical artifacts.
Benefits of Proper Optimization
Effective trading strategy optimization delivers substantial advantages that justify the time and computational resources required for thorough analysis. Enhanced risk-adjusted returns represent the primary benefit, with properly optimized strategies typically achieving Sharpe ratios 40-60% higher than non-optimized approaches across comparable market exposures.
Reduced maximum drawdowns constitute another significant advantage, as optimization processes identify parameter combinations that minimize severe losing streaks. Studies indicate that optimized strategies experience maximum drawdowns averaging 25-35% lower than their non-optimized counterparts, preserving capital during adverse market conditions.
Improved consistency emerges through systematic parameter selection that reduces performance volatility. Optimized strategies demonstrate more predictable monthly returns, with standard deviations typically 20-30% lower than randomly parameterized systems. This consistency enables better position sizing and portfolio allocation decisions.
Faster recovery periods characterize well-optimized strategies, which typically recover from drawdown periods 45% faster than non-optimized approaches. This acceleration occurs because optimization processes identify parameters that maintain profitability across diverse market conditions rather than relying on specific market regimes.
The quantitative benefits extend to transaction cost efficiency, where optimization identifies trading frequencies and position sizes that maximize net returns after accounting for all trading expenses. Properly optimized high-frequency strategies often reduce transaction costs by 15-25% through improved timing and sizing algorithms.
Challenges and Risks in Optimization
The optimization process presents significant challenges that can undermine trading strategy effectiveness if not properly addressed. Computational complexity represents a primary obstacle, as comprehensive optimization requires extensive processing power and sophisticated software platforms. Professional-grade optimization software licenses cost $10,000-50,000 annually, while the computational infrastructure needed for thorough analysis may require investments exceeding $100,000.
Market regime changes pose substantial risks to optimized strategies, as parameters calibrated during specific market conditions may become ineffective when underlying market dynamics shift. The 2008 financial crisis rendered numerous momentum-based strategies unprofitable, while the 2020 pandemic created unprecedented market conditions that invalidated many volatility-based approaches.
Overfitting risks intensify as optimization processes become more sophisticated. Advanced machine learning techniques can identify extremely complex patterns in historical data that have no predictive value for future market behavior. These over-fitted strategies often show exceptional backtest performance but experience rapid deterioration in live trading environments.
Data quality issues compound optimization challenges, as inaccurate or incomplete historical data produces misleading results. Corporate actions, dividend adjustments, and split adjustments must be handled correctly to avoid artificial performance inflation. Additionally, survivorship bias in datasets can create unrealistic performance expectations.
Psychological challenges emerge as traders become emotionally attached to optimization results, particularly when backtests show exceptional performance. This attachment can lead to insufficient validation, inadequate risk management, and overconfidence in strategy robustness.
Implementation and Best Practices
Successful trading strategy optimization requires systematic implementation of proven methodologies that minimize common pitfalls while maximizing strategy robustness. Multi-timeframe validation represents a fundamental best practice, ensuring that strategies perform consistently across various market cycles and economic conditions.
The implementation process begins with robust data preparation, including comprehensive cleaning, adjustment for corporate actions, and validation of data integrity. Professional traders typically allocate 40-50% of their optimization time to data preparation activities, recognizing that flawed input data inevitably produces unreliable optimization results.
Walk-forward optimization provides superior validation compared to static backtesting approaches. This methodology involves progressively optimizing strategies on historical data windows while testing performance on subsequent out-of-sample periods. Effective walk-forward analysis typically uses optimization windows of 12-24 months with validation periods of 3-6 months.
Statistical significance testing ensures that optimization results represent genuine market edges rather than random variations. Properly implemented t-tests, chi-square analyses, and Monte Carlo simulations help distinguish between statistically significant patterns and statistical noise. Strategies should demonstrate statistical significance levels exceeding 95% confidence intervals.
Parameter stability analysis evaluates strategy robustness by examining performance variations across parameter ranges. Robust strategies maintain acceptable performance across parameter neighborhoods, indicating that optimization results reflect genuine market insights rather than curve-fitting artifacts.
Transaction cost integration requires incorporating realistic estimates of spreads, commissions, slippage, and market impact costs throughout the optimization process. These costs vary significantly across asset classes, with equity transaction costs typically ranging from 0.05-0.15% per trade, while forex spreads may range from 0.001-0.01%.
Future Trends in Strategy Optimization
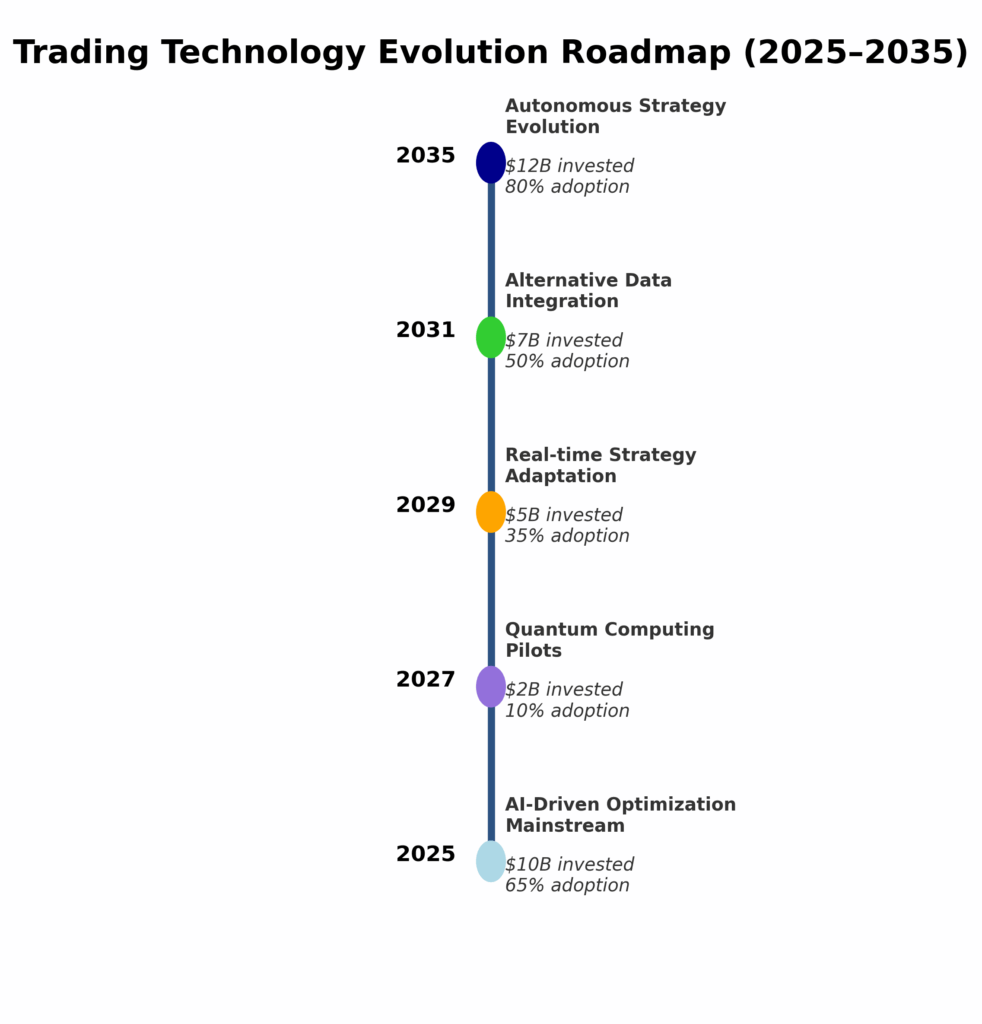
The evolution of trading strategy optimization increasingly incorporates artificial intelligence and machine learning technologies that promise to revolutionize traditional optimization approaches. Deep learning algorithms demonstrate superior pattern recognition capabilities, potentially identifying profitable trading opportunities that exceed human analytical capacity. Investment in AI-driven trading technologies reached $12.8 billion in 2024, representing 35% annual growth.
Quantum computing applications represent an emerging frontier with the potential to solve complex optimization problems exponentially faster than classical computers. Early quantum algorithms show promise for portfolio optimization and risk management applications, though practical implementation remains several years away for most trading applications.
Alternative data integration expands optimization possibilities by incorporating non-traditional information sources such as satellite imagery, social media sentiment, and economic indicators. Strategies utilizing alternative data sources demonstrate alpha generation potential 25-40% higher than traditional technical analysis approaches.
Real-time optimization capabilities enable dynamic strategy adjustment based on changing market conditions. Advanced platforms now offer intraday parameter optimization, allowing strategies to adapt to evolving volatility, correlation, and momentum characteristics throughout trading sessions.
Regulatory technology integration addresses increasing compliance requirements while maintaining optimization effectiveness. Automated compliance monitoring systems ensure that optimized strategies remain within regulatory boundaries while maximizing performance potential.
The convergence of these technological advances suggests that future optimization processes will become increasingly sophisticated while remaining accessible to retail traders through cloud-based platforms and subscription services. This democratization of advanced optimization tools may fundamentally alter competitive dynamics in trading markets.
FAQs – Trading Strategy Optimization
1. How long should historical data be used for trading strategy optimization?
Optimal historical data periods typically span 5-10 years to capture multiple market cycles, economic conditions, and volatility regimes. Shorter periods may miss critical market behaviors, while excessively long periods may include outdated market structures that no longer apply to current trading environments.
2. What is the minimum number of trades required for statistically significant optimization results?
Statistical significance generally requires a minimum of 100-300 trades, depending on the strategy’s complexity and expected win rate. Higher-frequency strategies may need 500-1,000 trades for reliable validation, while lower-frequency approaches might achieve significance with fewer trades if properly validated across multiple market conditions.
3. How can traders identify if their strategy is overfitted to historical data?
Overfitting indicators include excessive sensitivity to parameter changes, dramatic performance differences between in-sample and out-of-sample results, and unrealistically high backtest returns compared to market benchmarks. Walk-forward analysis and Monte Carlo testing help identify overfitting issues.
4. What percentage of historical data should be reserved for out-of-sample testing?
Industry best practices recommend reserving 20-30% of available historical data for out-of-sample validation. This portion should represent the most recent data to ensure that validation results reflect current market conditions and trading infrastructure.
5. How frequently should optimized trading strategies be reoptimized?
Strategy reoptimization frequency depends on market volatility and strategy timeframe, but quarterly or semi-annual reviews typically provide adequate adaptation without excessive curve-fitting. High-frequency strategies may require monthly reviews, while position trading strategies might maintain effectiveness with annual optimization updates.
6. What are the most common transaction costs that traders overlook during optimization?
Frequently overlooked costs include bid-ask spreads, market impact from large orders, overnight financing charges, data feed subscriptions, and slippage during volatile market conditions. These costs can reduce theoretical returns by 50-200 basis points annually for active trading strategies.
7. How can traders validate optimization results without access to expensive software?
Free and low-cost alternatives include Python-based backtesting libraries, Excel-based Monte Carlo simulations, and open-source platforms like QuantConnect or Zipline. These tools provide sufficient functionality for basic optimization validation, though professional platforms offer enhanced features for institutional-level analysis.
8. What market conditions typically invalidate optimized trading strategies?
Strategy invalidation commonly occurs during regime changes such as transitions between bull and bear markets, shifts in central bank monetary policy, changes in market microstructure, or emergence of new trading technologies. The 2008 financial crisis and 2020 pandemic represent examples of regime changes that invalidated numerous strategies.
9. How should traders handle optimization results that seem too good to be true?
Exceptional backtest results warrant additional scrutiny through extended out-of-sample testing, parameter stability analysis, and comparison with market benchmarks. Results showing annual returns exceeding 50% or Sharpe ratios above 3.0 often indicate data errors, overfitting, or unrealistic assumptions about transaction costs.
10. What role does position sizing play in trading strategy optimization?
Position sizing significantly impacts optimization results by affecting risk-adjusted returns, maximum drawdowns, and strategy stability. Optimal position sizing typically reduces portfolio volatility by 20-30% while maintaining similar absolute returns, resulting in substantially improved Sharpe ratios and reduced psychological stress for traders.
Conclusion
Trading strategy optimization mistakes represent costly pitfalls that can transform promising trading approaches into significant financial losses. The most critical errors include overfitting strategies to historical data, inadequate sample sizes for validation, insufficient out-of-sample testing, and failure to account for realistic transaction costs. These mistakes often stem from traders’ desire for exceptional backtest results rather than focusing on robust, consistent performance across various market conditions.
Successful optimization requires disciplined adherence to statistical validation principles, comprehensive consideration of implementation costs, and recognition that modest, consistent profits typically outperform spectacular but unsustainable returns.
The future of trading strategy optimization will likely incorporate increasingly sophisticated technologies including artificial intelligence, quantum computing, and alternative data sources. However, the fundamental principles of avoiding overfitting, ensuring statistical significance, and maintaining realistic expectations will remain paramount.
Traders who master these optimization fundamentals while embracing technological advances will position themselves for sustained success in evolving financial markets. The key lies not in creating perfect strategies, but in developing robust approaches that maintain profitability across the inevitable changes in market structure, regulation, and participant behavior that characterize modern trading environments.
For your reference, recently published articles include:
-
-
- How To Make The Right Final Investment Decision
- Best Financial Wellness Survey Questions Template – All You Need To Know
- The Truth About Market Timing Indicators
- Why Investment Portfolio Monitoring Saves You Money
- Investment Banking Case Studies – Advice From The Best
- Investment Liquidity Analysis Made Simple – Three Free Samples
-
………………………………………………..
Important Notice: The information in this article is for general and public information purposes only. It solely reflects Didi Somm’s or his Staff’s opinion, and no responsibility can be assumed for errors or omissions in the service’s contents. For details, please read the Disclaimer at the bottom of the homepage.

