In today’s increasingly complex financial landscape, accurately calculating investment returns is the cornerstone of building sustainable wealth. Mastering investment return calculation gives investors the clarity to evaluate performance, compare opportunities, and make data-driven decisions that compound wealth over time.
Key Takeaways
- Simple return calculations often mask the true performance of investments. When an investor earned 25% in year one and lost 20% in year two on a $10,000 investment, simple averaging suggests a 2.5% annual return, but the actual money-weighted return reveals a loss of 0.25% – a difference that compounds dramatically over decades.
- Time-weighted return (TWRR) metrics eliminate the distortion caused by cash flows, making them essential for evaluating investment manager performance. A portfolio manager who achieved exceptional 15% annual returns might show disappointing results when measured with simple return methods if clients added significant capital before market downturns – TWR correctly shows their skill independent of timing decisions they didn’t control.
- Different return metrics serve different purposes – using the wrong calculation for your specific need is a common but costly mistake. When comparing two investment opportunities, an angel investor correctly used IRR (Internal Rate of Return) to determine that a technology startup offering 40% IRR over five years was superior to a real estate project with 50% simple return over the same period, recognizing the impact of when returns were received.
Table of Contents
Understanding Investment Returns: The Foundation of Wealth Building
Investment returns represent the profits or losses generated by an investment over a specific period, typically expressed as a percentage of the initial investment amount. While this definition seems straightforward, the calculation methods can vary significantly depending on the investment type, time horizon, and specific circumstances of the investor.
The accuracy of return calculations directly impacts wealth-building strategies by influencing asset allocation decisions, risk management approaches, and ultimately, the achievement of financial goals. Sophisticated investors recognize that different return metrics serve different purposes – simple return calculations might suffice for quick comparisons, while complex metrics like Internal Rate of Return (IRR) provide deeper insights for multi-year investments with irregular cash flows.
Understanding return calculations is not merely an academic exercise but a practical necessity for modern investors. According to a 2023 study by Vanguard, investors who accurately tracked and understood their portfolio returns outperformed those who didn’t by an average of 1.8% annually – a difference that compounds to over 60% greater wealth over 25 years.

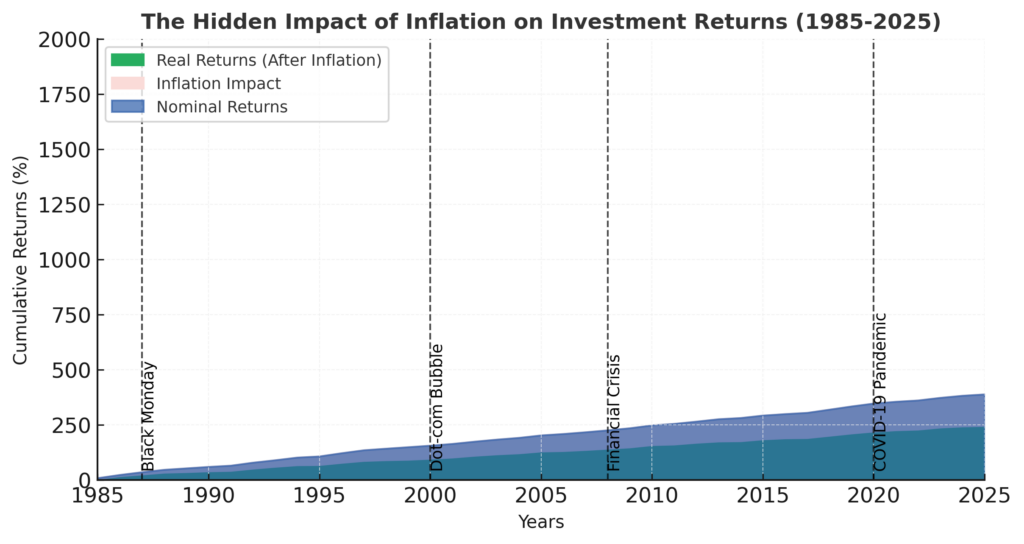
The distinction between nominal and real returns further complicates the picture. In 2023, an investment yielding a seemingly impressive 7% nominal return actually delivered only 2.5% in real purchasing power when accounting for the 4.5% inflation rate – highlighting why sophisticated return calculations matter for preserving and building actual wealth.
Types of Investment Return Calculations
Simple Return
Simple return, also known as the arithmetic return, is the most basic method for calculating investment performance.
Formula: Simple Return = (Ending Value – Beginning Value) / Beginning Value × 100%
For example, if you invest $10,000 and it grows to $12,000 in one year, the simple return is: ($12,000 – $10,000) / $10,000 × 100% = 20%
Advantages:
- Easy to calculate and understand
- Suitable for short-term investments with no cash flows
- Provides a quick performance snapshot
Limitations:
- Doesn’t account for the timing of cash flows
- Can be misleading for long-term performance evaluation
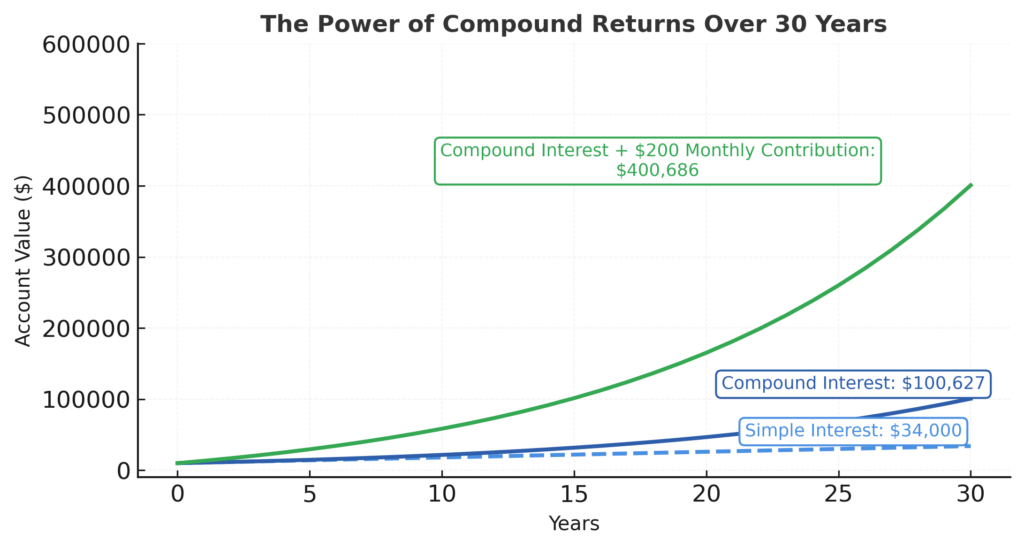
- Doesn’t consider compounding effects
Compound Annual Growth Rate (CAGR)
CAGR provides a smoothed annualized return over a multi-year period, accounting for compounding effects.
Formula: CAGR = (Ending Value / Beginning Value)^(1/n) – 1
Where n is the number of years.
For example, if a $10,000 investment grows to $16,105 over 5 years, the CAGR is: ($16,105 / $10,000)^(1/5) – 1 = 10%
Advantages:
- Accounts for compounding effects
- Provides a standardized annual rate for multi-year investments
- Enables fair comparison between investments with different time horizons
Limitations:
- Assumes constant growth rate (smooths volatility)
- Doesn’t account for interim cash flows
- May mask significant performance variations within the period
Internal Rate of Return (IRR)
IRR is the discount rate that makes the net present value (NPV) of all cash flows equal to zero. It’s particularly useful for investments with irregular cash flows.
Formula: 0 = CF₀ + CF₁/(1+IRR)¹ + CF₂/(1+IRR)² + … + CFₙ/(1+IRR)ⁿ
Where CF represents cash flows (negative for investments, positive for returns).
Advantages:
- Accounts for both timing and magnitude of all cash flows
- Considers the time value of money
- Ideal for complex investments like real estate, private equity, or venture capital
Limitations:
- More complex to calculate (usually requires software)
- Can produce multiple solutions for certain cash flow patterns
- May overstate performance for investments with early positive cash flows
Money-Weighted Return (MWR)
Also known as the dollar-weighted return, MWR is equivalent to IRR and measures the performance of an investment considering the size and timing of cash flows.
Advantages:
- Reflects the actual investor experience including timing decisions
- Accounts for cash flow impacts on overall performance
- Useful for assessing personal investment performance
Limitations:
- Makes it challenging to compare investment manager performance
- Influenced by the timing of deposits and withdrawals
- May attribute poor timing decisions to investment performance
Time-Weighted Return (TWR)
TWR measures investment performance independent of external cash flows, making it ideal for evaluating investment manager performance.
Formula: TWR = [(1 + R₁) × (1 + R₂) × … × (1 + Rₙ)] – 1
Where R represents returns between valuation points.
Advantages:
- Eliminates the impact of cash flow timing decisions
- Industry standard for evaluating investment managers
- Allows fair comparison between different managers
Limitations:
- May not reflect an individual investor’s actual experience
- Requires frequent portfolio valuations, especially around cash flow events
- More complex to calculate than simple returns
Real Return vs. Nominal Return
Nominal Return represents the return without accounting for inflation.
Real Return adjusts for inflation to reflect the actual purchasing power gained.
Formula: Real Return ≈ Nominal Return – Inflation Rate
For example, if an investment generates a 9% nominal return during a period with 4% inflation: Real Return ≈ 9% – 4% = 5%
Significance:
- Real returns provide a more accurate picture of wealth-building potential
- Essential for long-term financial planning
- Allows for meaningful historical comparisons across different inflation environments

Risk-Adjusted Returns
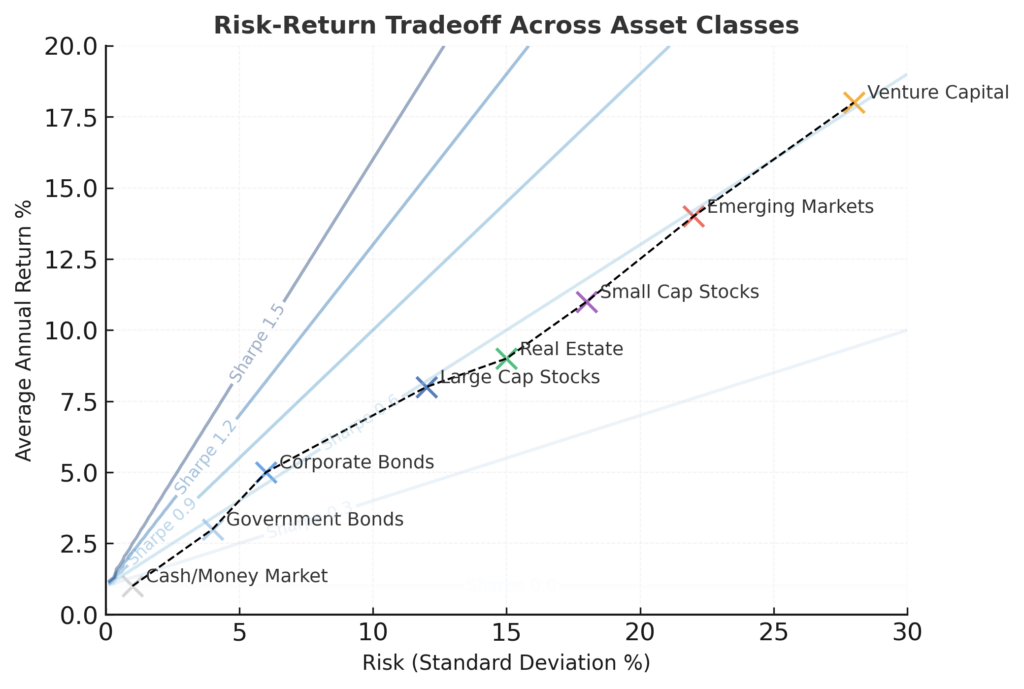
These metrics evaluate investment performance relative to the risk taken.
Sharpe Ratio
Measures excess return per unit of risk.
Formula: Sharpe Ratio = (Investment Return – Risk-Free Rate) / Standard Deviation of Investment Returns
Sortino Ratio
Similar to Sharpe, but only penalizes downside risk.
Treynor Ratio
Measures excess return per unit of market risk (beta).
Importance:
- Provides context for raw return numbers
- Helps identify investments that deliver better returns for the level of risk
- Essential for constructing optimized portfolios

Comparison of Return Calculation Methods
| Return Metric | Best Used For | Advantages | Limitations | Typical Users |
|---|---|---|---|---|
| Simple Return | Short-term investments, Quick assessments | Easy to calculate, Intuitive | Ignores compounding, Timing of flows | Individual investors, Media reporting |
| CAGR | Multi-year investments without cash flows | Accounts for compounding, Standardizes periods | Smooths volatility, Ignores interim flows | Financial analysts, Fund marketing |
| IRR/MWR | Complex investments with irregular cash flows | Accounts for flow timing, Measures investor experience | Complex calculations, Multiple solutions possible | Real estate investors, Private equity |
| TWR | Evaluating investment manager performance | Eliminates impact of client deposit/withdrawal timing | May not match investor experience | Professional asset managers, Institutional investors |
| Risk-Adjusted (Sharpe, Sortino) | Portfolio optimization, Manager selection | Incorporates risk assessment, Better for comparisons | Requires statistical knowledge, Assumes normal distributions | Sophisticated investors, Institutional allocators |
Benefits of Mastering Return Calculations
More Accurate Performance Evaluation
Understanding sophisticated return calculations enables investors to assess performance more accurately across different asset classes and time periods. This precision prevents both unwarranted complacency and unnecessary panic when reviewing investment results.
For example, an investor comparing two mutual funds might see that Fund A returned 45% over three years while Fund B returned 42%. Without calculating annualized returns, the investor might miss that Fund A’s returns were concentrated in year one followed by underperformance, while Fund B showed consistent growth – indicating potentially superior management at Fund B.
Better Investment Decision-Making
Armed with proper return metrics, investors can make more informed decisions about asset allocation, manager selection, and specific investment opportunities.
A wealth manager using risk-adjusted return metrics might determine that a hedge fund returning 12% annually with high volatility (Sharpe ratio of 0.7) is actually inferior to a diversified ETF portfolio returning 10% with lower volatility (Sharpe ratio of 1.2) – insight that would be missed by focusing solely on raw returns.
Enhanced Communication with Advisors
Investors who understand return calculations can engage more effectively with financial advisors, asking pertinent questions and critically evaluating recommendations.
Realistic Expectations and Goal Setting
By understanding historical returns in proper context, investors can set realistic expectations and create achievable financial goals based on sound mathematical principles rather than marketing claims.
According to a J.P. Morgan analysis, investors who based their retirement planning on simple average returns often underestimated required savings by 25-30% compared to those who used more sophisticated return models accounting for sequence risk and withdrawal patterns.
Tax Efficiency Optimization
Advanced return calculations that incorporate tax impacts allow investors to optimize after-tax returns, which ultimately determine actual wealth accumulation.
A high-income investor comparing municipal bonds yielding 4% (tax-free) with corporate bonds yielding 5.2% (taxable at 37%) would recognize the municipal bonds offer superior after-tax returns of 4% versus 3.28% – a distinction only visible when calculating tax-adjusted returns.
Challenges and Risks in Return Calculations
Data Accuracy and Availability
Calculating accurate returns requires comprehensive and precise data, which can be difficult to obtain, especially for alternative investments or complex portfolios spanning multiple accounts.
Misapplication of Methodologies
Using inappropriate return calculation methods for specific situations leads to misleading conclusions. This error often occurs when investors apply simple metrics to complex investment structures or vice versa.
Cognitive Biases
Humans have natural tendencies toward recency bias, confirmation bias, and innumeracy that can interfere with objective analysis of return data, regardless of calculation accuracy.
Market Volatility Distortions
Extreme market volatility can create distortions in short-term return calculations, potentially leading to flawed long-term decisions if not properly contextualized.
During the March 2020 COVID-19 market crash, many investments showed dramatic negative returns that, if annualized using simple methods, suggested catastrophic long-term projections that proved wildly inaccurate for investors who maintained positions through the recovery.
Benchmark Selection Problems
Choosing inappropriate benchmarks for comparison can lead to misleading conclusions about relative performance, even when return calculations themselves are accurate.
A small-cap value fund manager showing 12% annual returns might appear unsuccessful when compared to the S&P 500’s 15% return during a period when large-cap growth stocks dominated, despite outperforming their appropriate small-cap value benchmark by 3 percentage points.
Software and Calculator Limitations
Investment apps and calculators may use simplified return methodologies that don’t capture important nuances, especially for complex portfolios.
How to Calculate Returns: Step-by-Step Implementation
Simple Return Calculation
- Determine your beginning investment value
- Identify your ending investment value
- Subtract beginning value from ending value
- Divide the result by the beginning value
- Multiply by 100 to convert to a percentage
Example:
- Beginning value: $25,000
- Ending value: $28,750
- Return: ($28,750 – $25,000) / $25,000 × 100% = 15%
CAGR Calculation
- Determine your beginning investment value
- Identify your ending investment value
- Determine the number of years
- Divide ending value by beginning value
- Raise the result to the power of (1/number of years)
- Subtract 1 and multiply by 100 to get percentage
Example:
- Beginning value: $50,000
- Ending value after 4 years: $77,716
- CAGR: ($77,716 / $50,000)^(1/4) – 1 = 11.67%
IRR Calculation
- List all cash flows with dates (negative for investments, positive for returns)
- Use financial calculator, spreadsheet function (e.g., XIRR in Excel), or specialized software
- Verify the result makes logical sense
Example:
- Initial investment (Year 0): -$100,000
- Year 1 cash flow: $5,000
- Year 2 cash flow: $8,000
- Year 3 cash flow: $12,000
- Year 4 cash flow: $15,000
- Year 5 final value plus cash flow: $130,000
- IRR: 10.37%
TWR Calculation
- Value the portfolio immediately before and after each cash flow
- Calculate the return between each valuation point
- Link these returns by multiplying (1 + R) for each period
- Subtract 1 from the result
Example:
- Period 1 return: 5%
- Period 2 return: -2%
- Period 3 return: 8%
- TWR: [(1 + 0.05) × (1 – 0.02) × (1 + 0.08)] – 1 = 11.05%
Risk-Adjusted Return Calculation (Sharpe Ratio)
- Calculate the investment’s average return over period
- Determine the risk-free rate for the same period
- Calculate the standard deviation of investment returns
- Subtract risk-free rate from investment return
- Divide by standard deviation
Example:
- Average annual return: 12%
- Risk-free rate: 3%
- Standard deviation: 15%
- Sharpe Ratio: (12% – 3%) / 15% = 0.60
Tools and Resources for Return Calculations
Spreadsheet Applications
- Microsoft Excel: XIRR, RATE, IRR functions
- Google Sheets: Similar functionality to Excel with cloud-based accessibility
Financial Calculators
- Texas Instruments BA II Plus: Industry standard for financial calculations
- HP 12C: Popular among financial professionals
Investment Platforms
- Morningstar: Provides comprehensive return metrics for mutual funds and ETFs
- Portfolio Visualizer: Online tool for sophisticated portfolio analysis and return calculations
Professional Software
- Bloomberg Terminal: Industry-leading financial analysis platform
- FactSet: Comprehensive investment analysis tools
- Refinitiv Eikon: Financial analysis and calculation tools
Mobile Applications
- Personal Capital: Tracks investment performance across accounts
- Portfolio Performance: Open-source portfolio tracking and return calculation
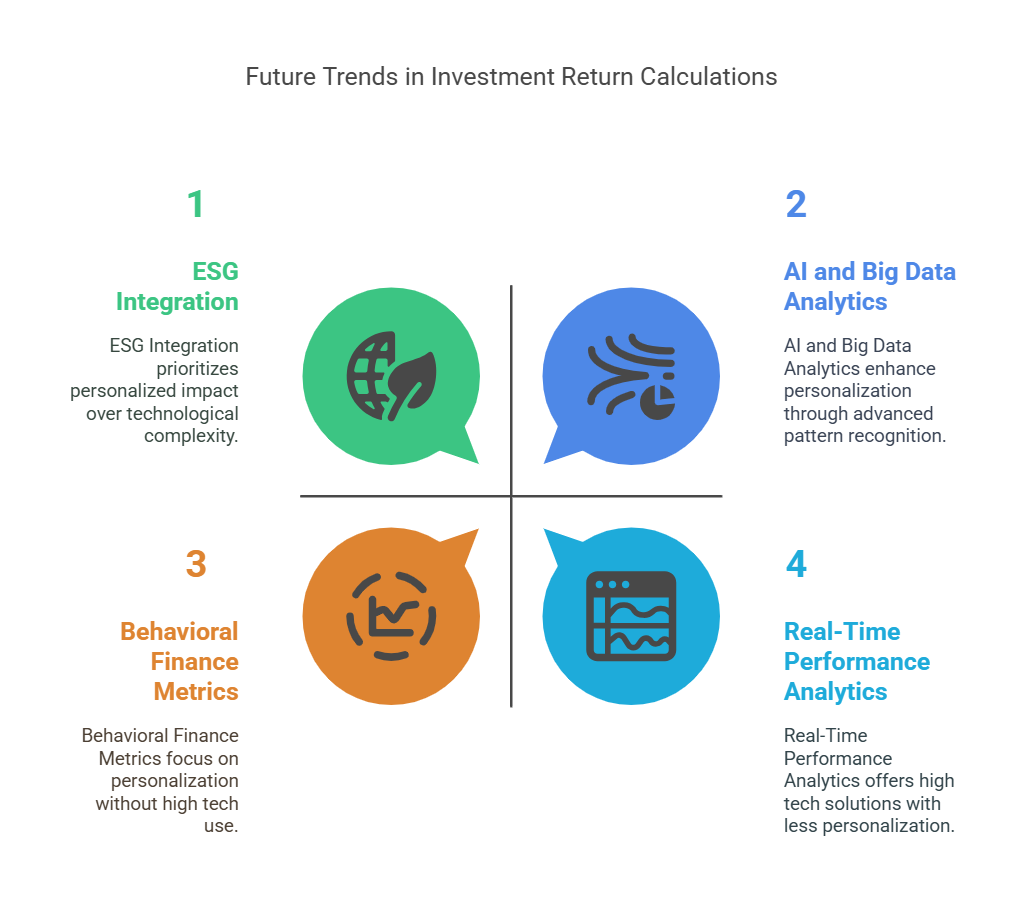
Future Trends in Investment Return Calculations
Increased Granularity and Customization
Return calculations are becoming increasingly personalized, with metrics tailored to specific investor goals, time horizons, and risk tolerances rather than standardized benchmarks. By 2026, expect to see mainstream investment platforms offering goal-based return tracking that dynamically adjusts based on individual financial objectives.
Integration of Environmental, Social, and Governance (ESG) Factors
Return calculations are evolving to incorporate ESG impact alongside financial performance. According to Morgan Stanley research, 78% of institutional investors now integrate ESG considerations into their return assessment frameworks – a trend rapidly spreading to retail investor tools.
Artificial Intelligence and Big Data Analytics
Machine learning algorithms are enhancing return calculations by identifying subtle patterns and correlations that traditional methods miss. JP Morgan’s AI-powered return analysis system detected that traditional metrics underestimated the impact of sentiment shifts on emerging market returns by approximately 2.3 percentage points annually.
Real-Time Performance Analytics
Technological advances are enabling continuous real-time return calculations rather than periodic snapshots, giving investors more timely information for decision-making. Leading wealth management platforms now offer intraday performance metrics that incorporate multiple return calculation methodologies simultaneously.
Blockchain-Based Verification
Blockchain technology is beginning to revolutionize return verification by creating immutable records of transaction history and performance claims. This transparency will become increasingly important as investors demand greater accountability from investment managers and platforms.
Integration of Behavioral Finance Metrics
Return calculations are starting to incorporate behavioral factors, recognizing that investor behavior significantly impacts actual realized returns. Vanguard’s Advisor’s Alpha research shows that behavioral coaching alone can add approximately 1.5% in net returns annually by helping investors avoid common timing mistakes.

FAQs – Investment Return Calculation
1. What is the difference between arithmetic average return and geometric average return?
Arithmetic average return is the simple mean of periodic returns, calculated by summing all returns and dividing by the number of periods. Geometric average return (CAGR) accounts for compounding by linking returns multiplicatively. For volatile investments, arithmetic averages will always be higher than geometric averages. For example, an investment that gains 50% in year one and loses 40% in year two has an arithmetic average of +5% annually but a geometric average of -7.3% annually.
2. Why might two investors in the same fund experience different returns?
Two investors can experience different returns in the same fund due to the timing of their cash flows. If Investor A invested a lump sum before a market upswing while Investor B dollar-cost averaged through both up and down periods, their money-weighted returns would differ significantly despite holding the same fund. This is why personal investment returns often diverge from published fund returns.
3. How do dividends and distributions affect return calculations?
Dividends and distributions increase total return when reinvested but must be properly accounted for in calculations. Total return includes both price appreciation and income (dividends/interest), while price return excludes income. For example, a stock that appreciates 7% while paying a 3% dividend yield actually provides a 10% total return if dividends are reinvested – a significant difference that compounds dramatically over time.
4. What return metric should I use when comparing different types of investments?
When comparing different investment types, use risk-adjusted returns like the Sharpe ratio for the most meaningful comparison, as raw returns without context can be misleading. For investments with similar risk profiles but different cash flow patterns, IRR provides the most accurate comparison by accounting for the timing of cash flows.
5. How do fees impact investment returns?
Fees directly reduce investment returns and compound negatively over time. A seemingly small difference between a 0.1% and 1% expense ratio on an index fund represents approximately 24% less wealth over 30 years on a $100,000 investment growing at 7% annually. Always calculate returns net of all fees for accurate performance assessment.
6. Can past returns predict future performance?
Past returns alone have limited predictive value for future performance. Studies consistently show little persistence in outperformance beyond what would be expected by chance. However, risk-adjusted metrics like Sharpe ratio show somewhat better persistence. Focus on understanding the drivers behind returns rather than extrapolating past performance.
7. How should I calculate returns for a portfolio with multiple asset classes?
For a multi-asset portfolio, calculate time-weighted returns for the entire portfolio to evaluate overall performance. Additionally, calculate the returns for each asset class separately to assess their individual contributions. Attribution analysis can then determine whether performance came from asset allocation decisions or security selection within asset classes.
8. What is a good annual return on investments?
“Good” returns vary based on risk level, time period, and comparison to appropriate benchmarks. Historically, U.S. large-cap stocks have returned approximately 10% annually before inflation (7% real returns), while bonds have returned about 5% nominally (2-3% real). Higher-risk investments should deliver higher returns to compensate for additional volatility.
9. How do taxes affect investment return calculations?
Taxes can significantly reduce effective returns, especially for high-income investors. When comparing taxable and tax-advantaged investments, calculate after-tax returns by applying your marginal tax rate to interest, dividends, and realized capital gains. For example, an investor in the 35% tax bracket would keep only $65 of every $100 in taxable interest, effectively reducing a 5% yield to 3.25%.
10. How should I account for inflation in my return calculations?
To account for inflation, subtract the inflation rate from nominal returns to determine real returns. For long-term planning, using real returns provides a more accurate picture of future purchasing power. For example, the historical 10% nominal return on U.S. stocks translates to approximately 7% after accounting for the long-term inflation average of 3%.
Conclusion
Mastering investment return calculations is an essential skill for serious wealth builders in today’s complex financial landscape. By understanding and appropriately applying different return metrics – from simple returns to sophisticated measures like time-weighted and risk-adjusted returns – investors gain valuable insights that drive better decision-making and ultimately lead to superior outcomes.
The future of return calculations is increasingly sophisticated, with artificial intelligence, real-time analytics, and customized metrics tailored to individual investor goals. However, the fundamental principles remain constant: accurate return assessment requires proper methodology selection, consistent application, and thoughtful interpretation within the context of risk, time horizon, and personal financial objectives.
By applying the formulas and approaches outlined in this guide, investors can move beyond simplistic performance snapshots to develop a nuanced understanding of their investments’ true effectiveness. This knowledge empowers more informed asset allocation, manager selection, and portfolio optimization – the building blocks of sustainable wealth creation in an increasingly complex financial world.
For your reference, recently published articles include:
- Never Lose Money Again: The Ultimate Portfolio Diversification Tools
- Risk-Proof Your Wealth: Professional Investment Risk Scoring Methods Revealed
- Market Trend Analysis: Technical Analysis Secrets Exposed
- Digital Age Success Story: With AI To Private Wealth
- Investment Portfolio Tracking: Best Billionaire Hacks For You
- 10X Your Money: Growth Investing Analytics That Work
………………………………………………..
Important Notice: The information in this article is for general and public information purposes only. It solely reflects Didi Somm’s or his Staff’s opinion, and no responsibility can be assumed for errors or omissions in the service’s contents. For details, please check the Disclaimer at the bottom of the homepage.

