Investment liquidity analysis serves as the cornerstone of sound financial decision-making, determining how quickly and efficiently assets can be converted to cash without significant price impact.
In today’s volatile financial markets, understanding liquidity dynamics becomes crucial for portfolio management, risk assessment, and strategic asset allocation. This comprehensive analysis enables investors to optimize their holdings while maintaining adequate cash flow for both opportunities and emergencies.
Welcome to our in-depth exploration of investment liquidity analysis. We’re excited to help you master these essential portfolio management techniques!
Be sure to sign up on our home page and GET THREE FREE SAMPLES related to this article, in addition to our free Newsletter & Smart Investing Guide that will take your investment skills to the next level.
Key Takeaways
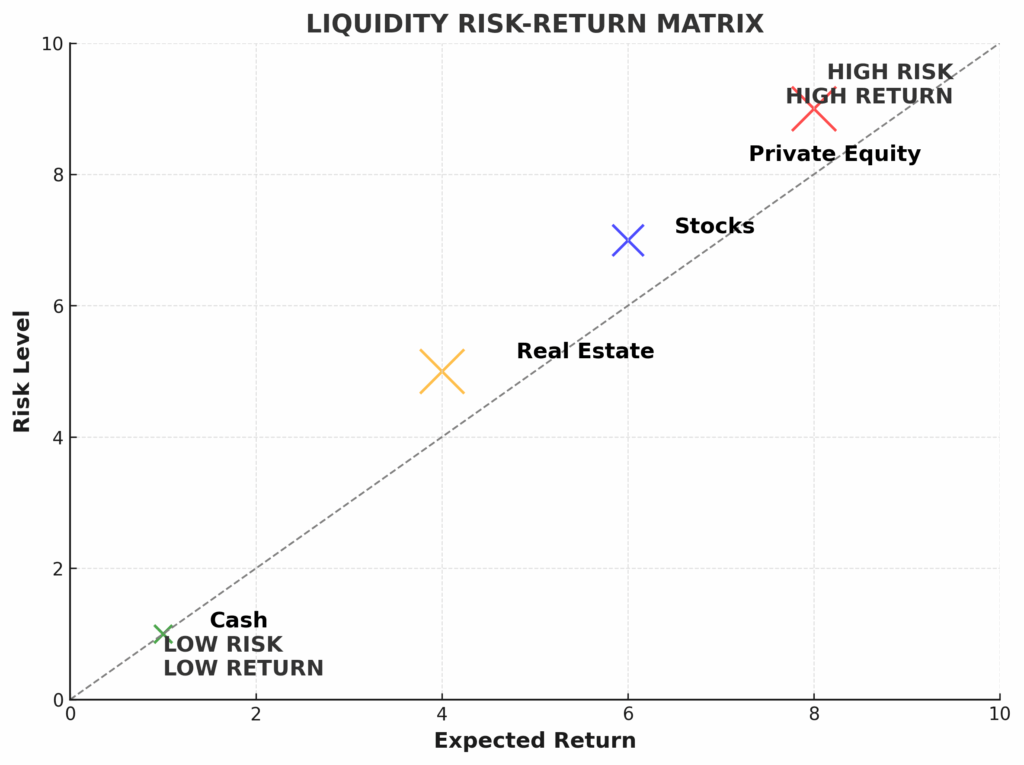
1. liquidity Risk Directly Impacts Returns: Assets with poor liquidity typically require a liquidity premium of 2-4% annually to compensate investors for the additional risk. For example, private equity investments often demand 15-20% returns compared to 8-10% for liquid public equities, partly due to their 5-10 year lock-up periods.
2. Market Conditions Amplify Liquidity Constraints: During the 2008 financial crisis, previously liquid assets like corporate bonds saw bid-ask spreads widen from 0.1% to over 2%, while some real estate investment trusts (REITs) experienced 50-70% price declines despite underlying property values falling only 20-30%.
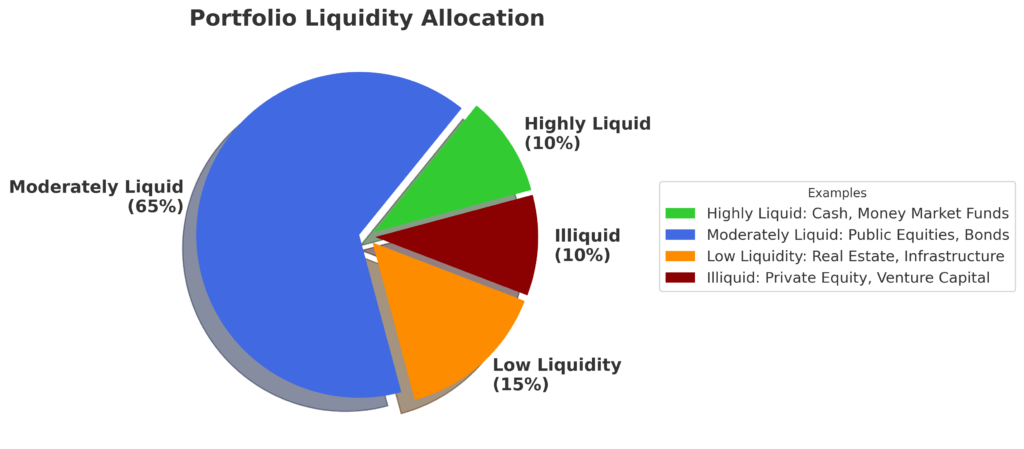
3. Diversification Across Liquidity Tiers Enhances Portfolio Resilience: Professional investors typically maintain 5-15% in highly liquid assets (cash, money market funds), 60-75% in moderately liquid investments (public stocks, bonds), and 10-30% in illiquid alternatives (private equity, real estate) to balance returns with accessibility.
Understanding Investment Liquidity Analysis
Investment liquidity analysis represents a systematic evaluation of how readily an asset can be bought or sold in the market without causing substantial price movement. This analysis encompasses multiple dimensions, including market depth, trading volume, bid-ask spreads, and the time required to complete transactions at fair market value.
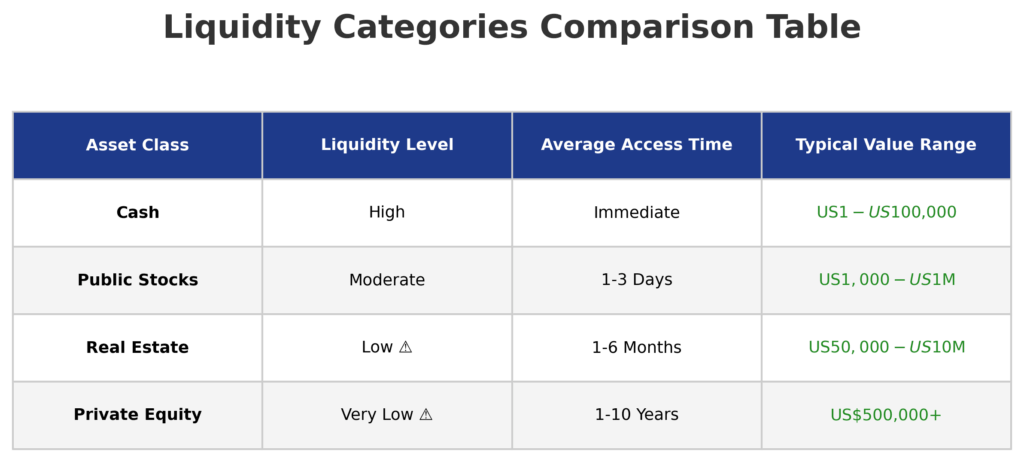
The fundamental principle underlying liquidity analysis centers on the liquidity-return tradeoff. Highly liquid assets, such as large-cap stocks or government bonds, typically offer lower returns due to their easy convertibility to cash. Conversely, illiquid investments like private equity or real estate often provide higher potential returns to compensate investors for the inability to quickly access their capital.
Modern liquidity analysis extends beyond simple trading volume metrics to incorporate sophisticated measures such as the Amihud illiquidity ratio, which calculates price impact per dollar of trading volume, and turnover ratios, which indicate how frequently an asset changes hands. These metrics provide deeper insights into true liquidity conditions than traditional measures alone.
Market microstructure plays a crucial role in liquidity analysis, as factors such as market maker presence, electronic trading systems, and regulatory frameworks significantly impact an asset’s liquidity profile. The rise of high-frequency trading has generally improved liquidity for major securities while potentially creating new vulnerabilities during stress periods.
Institutional considerations further complicate liquidity analysis, as large investors face different constraints than individual traders. A $10 million position in a small-cap stock may require days or weeks to liquidate without substantial price impact, while the same amount in a large-cap stock might be sold within minutes at prevailing market prices.
Types of Investment Liquidity
Market Liquidity Categories
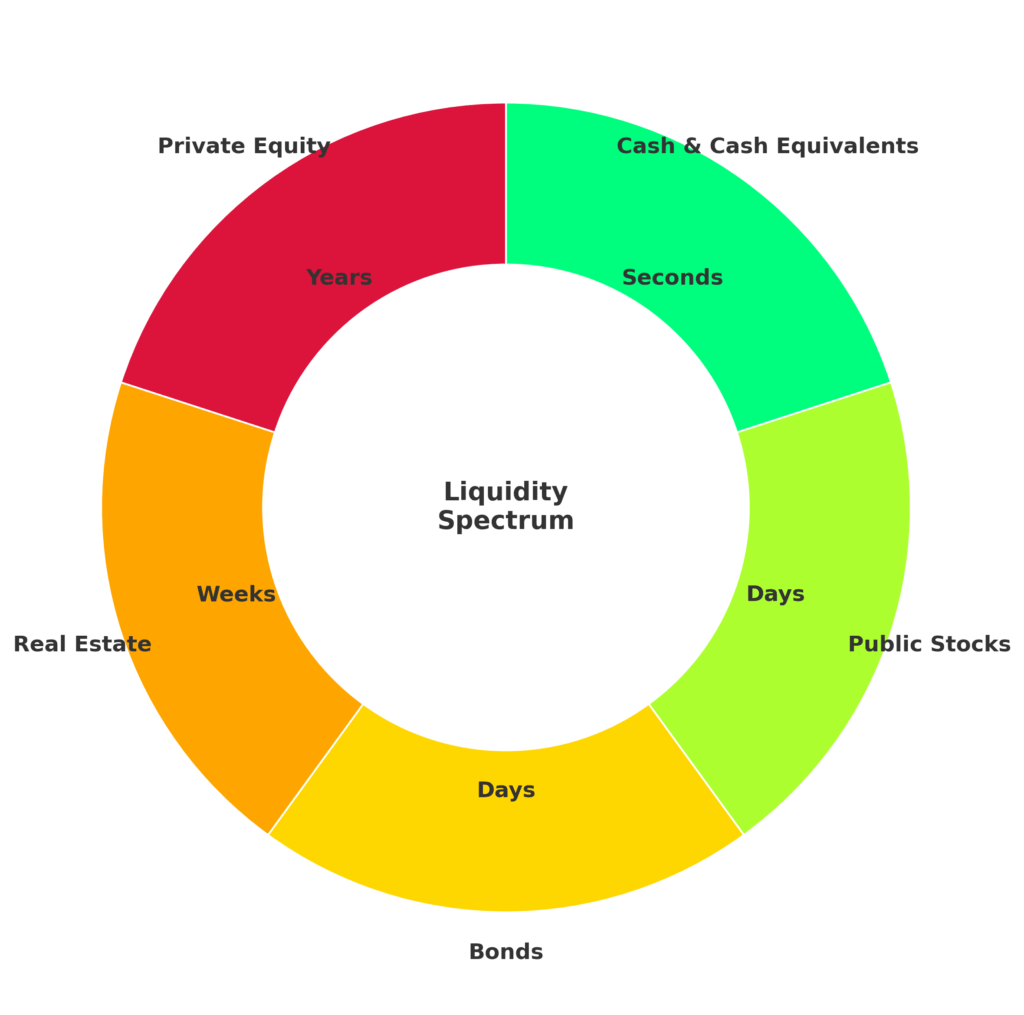
| Liquidity Level | Time to Liquidate | Examples | Typical Bid-Ask Spread |
|---|---|---|---|
| Highly Liquid | Seconds to Minutes | S&P 500 ETFs, US Treasuries | 0.01-0.05% |
| Moderately Liquid | Hours to Days | Mid-cap stocks, Corporate bonds | 0.1-0.5% |
| Low Liquidity | Days to Weeks | Small-cap stocks, Municipal bonds | 0.5-2% |
| Illiquid | Months to Years | Private equity, Real estate | 5-15% |
Funding Liquidity vs. Market Liquidity
Funding liquidity refers to the ease with which investors can obtain financing to purchase assets or meet margin calls. This type of liquidity became critically important during the 2008 crisis when credit markets froze, forcing leveraged investors to sell assets regardless of market conditions.
Market liquidity, conversely, measures how quickly assets can be traded without affecting their price. The interaction between these two liquidity types creates complex dynamics that can amplify market volatility during stress periods.
Benefits of Investment Liquidity Analysis
Risk Management Enhancement
Comprehensive liquidity analysis enables investors to identify potential liquidity traps before they materialize. By understanding which assets might become difficult to sell during market stress, investors can maintain appropriate diversification across liquidity tiers and avoid concentration in illiquid positions.
Portfolio Optimization
Liquidity analysis facilitates optimal asset allocation by quantifying the liquidity premium embedded in different investments. This enables investors to make informed decisions about whether the additional return potential of illiquid assets justifies their accessibility constraints.
Strategic Opportunity Positioning
Understanding liquidity dynamics allows investors to position themselves advantageously during market dislocations. Those with adequate liquid reserves can capitalize on forced selling by liquidity-constrained investors, often acquiring quality assets at significant discounts.
Cash Flow Planning
For institutional investors, liquidity analysis proves essential for matching asset liquidity with liability requirements. Pension funds, for instance, must ensure sufficient liquid assets to meet benefit payments while maximizing returns through strategic illiquid investments.
Challenges and Risks in Liquidity Analysis
Liquidity Illusion
Many investors fall victim to liquidity illusion, assuming that historical liquidity patterns will persist during stressed market conditions. The 2020 COVID-19 market crash demonstrated how quickly even highly liquid markets can become dysfunctional, with some ETFs trading at 10-15% discounts to their underlying assets.
Measurement Difficulties
Quantifying liquidity presents significant challenges, as traditional metrics often fail to capture the full complexity of liquidity dynamics. Bid-ask spreads may widen dramatically during volatile periods, while trading volume can increase due to forced selling rather than healthy market activity.
Liquidity Spirals
Liquidity spirals occur when asset price declines trigger margin calls, forcing leveraged investors to sell additional assets, further depressing prices, and creating additional margin requirements. This self-reinforcing cycle can rapidly transform moderately liquid assets into illiquid ones.
Regulatory and Structural Risks
Regulatory changes can dramatically alter liquidity landscapes. The Volcker Rule’s restrictions on proprietary trading reduced market-making capacity for many securities, while new capital requirements have made banks less willing to provide liquidity during stress periods.
Implementation of Liquidity Analysis
Quantitative Metrics
Amihud Illiquidity Ratio: Calculated as the daily absolute return divided by dollar trading volume, this metric measures price impact per dollar traded. Higher ratios indicate greater illiquidity.
Turnover Ratio: Computed as trading volume divided by market capitalization, this ratio indicates how frequently shares change hands. Higher turnover generally suggests better liquidity.
Bid-Ask Spread Analysis: Regular monitoring of spreads provides real-time liquidity insights, with widening spreads indicating deteriorating liquidity conditions.
Portfolio-Level Implementation
| Analysis Component | Frequency | Key Metrics | Action Triggers |
|---|---|---|---|
| Asset-Level Liquidity | Daily | Bid-ask spreads, Volume | Spread >2x average |
| Portfolio Liquidity | Weekly | Weighted average liquidity | <10% highly liquid |
| Stress Testing | Monthly | Liquidity-at-Risk | VaR >portfolio limit |
| Rebalancing Review | Quarterly | Liquidity allocation | Deviation >5% target |
Stress Testing Frameworks
Comprehensive liquidity analysis requires stress testing under various market scenarios. This involves modeling how liquidity conditions might deteriorate during different crisis types, such as credit crunches, market crashes, or sector-specific disruptions.
Future Trends in Liquidity Analysis
Technology Integration
Artificial intelligence and machine learning technologies are revolutionizing liquidity analysis by processing vast amounts of market microstructure data to predict liquidity conditions. These systems can identify subtle patterns that traditional analysis might miss.
Blockchain and DeFi Impact
Decentralized finance (DeFi) protocols are creating new liquidity dynamics through the use of automated market makers and liquidity pools. These innovations may eventually reduce traditional liquidity constraints while creating new risk categories.
Regulatory Evolution
Regulatory frameworks continue evolving to address liquidity risks highlighted by recent market crises. New rules requiring enhanced liquidity reporting and stress testing are likely to improve market transparency while potentially constraining certain investment strategies.
Climate Risk Integration
Environmental, social, and governance (ESG) factors are increasingly influencing liquidity analysis, as climate-related risks may lead to sudden liquidity shortages in affected sectors. Stranded assets in fossil fuel industries exemplify how fundamental changes can rapidly alter liquidity profiles.
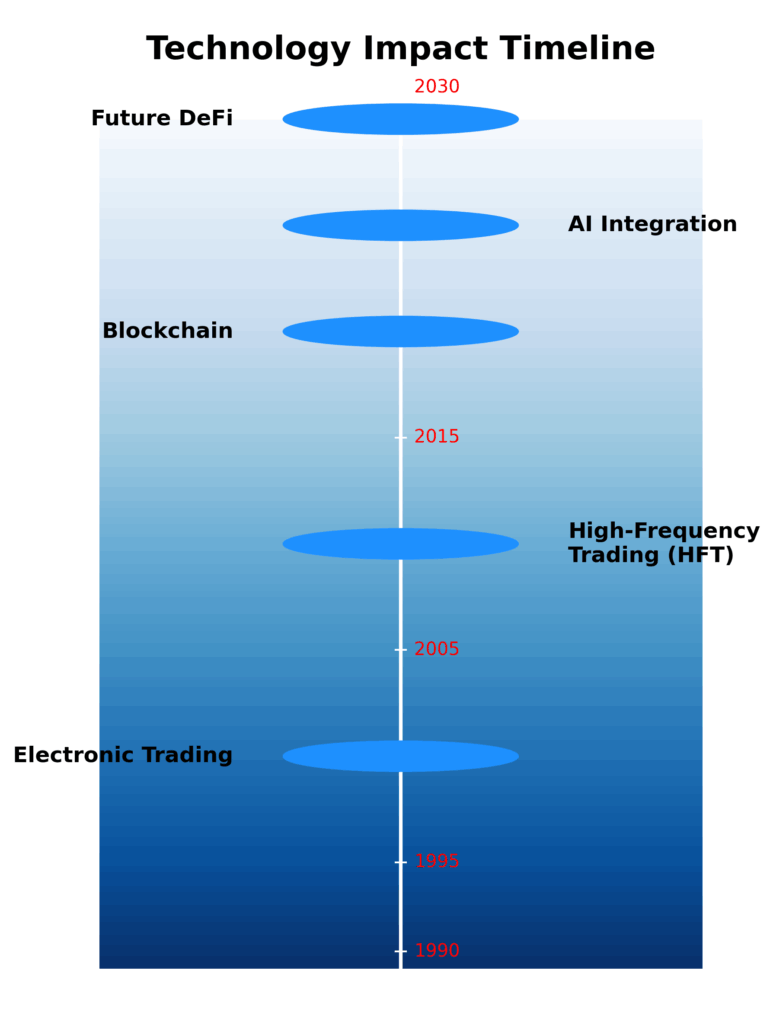
As markets evolve, so too must our approaches to investment liquidity analysis to remain competitive.
FAQs – Investment Liquidity Analysis
1. What is the difference between liquidity and solvency in investment analysis?
Liquidity refers to the ability to quickly convert assets to cash without significant price impact, while solvency measures whether total assets exceed total liabilities. An investor can be solvent but illiquid, owning valuable assets that cannot be quickly monetized.
2. How do market makers affect investment liquidity?
Market makers provide continuous bid and ask quotes, facilitating trading by standing ready to buy or sell securities. Their presence typically reduces bid-ask spreads and increases trading volume, significantly improving liquidity. However, market makers may withdraw during extreme volatility, causing liquidity to evaporate.
3. What percentage of a portfolio should be kept in highly liquid assets?
Most financial advisors recommend maintaining 5-15% of investment portfolios in highly liquid assets, though this varies based on individual circumstances. Conservative investors or those approaching retirement might prefer 15-25%, while aggressive investors might maintain only 5-10%.
4. How does leverage affect liquidity analysis?
Leverage amplifies liquidity risks by creating forced selling scenarios when margin calls occur. Highly leveraged positions may require rapid liquidation regardless of market conditions, potentially forcing investors to sell assets at unfavorable prices during illiquid periods.
5. What tools are available for conducting liquidity analysis?
Professional investors use various tools, including Bloomberg terminals, Refinitiv platforms, and specialized liquidity analytics software. Retail investors can access basic liquidity metrics through most brokerage platforms, including bid-ask spreads, trading volume, and average daily volume data.
6. How has electronic trading affected market liquidity?
Electronic trading has generally improved liquidity by reducing transaction costs and increasing market access. However, it has also contributed to increased market volatility and potential flash crashes, where liquidity can disappear rapidly during stressed conditions.
7. What role does asset size play in liquidity analysis?
Asset size significantly impacts liquidity, with larger positions typically requiring more time to liquidate without price impact. A $1 million position in a small-cap stock might take days to sell, while the same amount in a large-cap stock could be sold within minutes.
8. How do international investments affect portfolio liquidity?
International investments often carry additional liquidity risks due to different market structures, time zones, currency considerations, and regulatory frameworks. Emerging market securities typically exhibit lower liquidity than developed market equivalents.
9. What is liquidity risk premium, and how is it calculated?
Liquidity risk premium represents the additional return investors demand for holding less liquid assets. It is typically calculated by comparing yields or returns between similar assets with different liquidity profiles, often ranging from 1-5% annually depending on the asset class.
10. How often should liquidity analysis be performed?
Liquidity analysis frequency depends on portfolio complexity and market conditions. Most institutional investors perform daily monitoring of key liquidity metrics, weekly portfolio-level analysis, and monthly comprehensive reviews. Individual investors should conduct quarterly reviews at minimum, with more frequent analysis during volatile periods.
Conclusion
Investment liquidity analysis represents a critical component of modern portfolio management, providing essential insights for risk management, strategic allocation, and opportunity identification.
As demonstrated throughout this analysis, understanding liquidity dynamics enables investors to make informed decisions about the trade-offs between returns and accessibility while avoiding potential liquidity traps that can severely impact portfolio performance.
The evolving landscape of financial markets, driven by technological innovation, regulatory changes, and shifting investor preferences, continues to reshape liquidity dynamics across asset classes. Successful investors must adapt their liquidity analysis frameworks to account for these changes while maintaining focus on fundamental principles of diversification, risk management, and strategic positioning.
By implementing comprehensive liquidity analysis practices, investors can better navigate market volatility, capitalize on opportunities, and build more resilient portfolios capable of weathering various market conditions while meeting their long-term financial objectives.
For your reference, recently published articles include:
-
-
- How To Use Risk Tolerance Questionnaire Example For Better Results
- Master Your Wealth: Financial Disclaimers Explained
- Rate Volume Analysis: Best Expert Advice For Your Success
- Irrational Investing: Why Emotions Destroy Your Portfolio
- Investment Risk Monitoring – All You Need To Know
- How to Become a Rational Investor in 2025
-
………………………………………………..
Important Notice: The information in this article is for general and public information purposes only. It solely reflects Didi Somm’s or his Staff’s opinion, and no responsibility can be assumed for errors or omissions in the service’s contents. For details, please read the Disclaimer at the bottom of the homepage

