The Smart Money Advantage
78% of retail investors make buy and sell decisions without ever looking at institutional ownership data – the same data that hedge funds pay millions to analyze in real-time. You’re trading in a market where institutions control over 80% of daily volume, yet most individual investors have no idea which stocks are being accumulated or distributed by the smartest money managers on Wall Street. This information asymmetry costs retail traders billions annually in missed opportunities and poorly-timed entries.
Here’s the reality: institutional ownership data isn’t just another technical indicator – it’s a window into where the most sophisticated investors with the deepest research capabilities are placing billion-dollar bets. In today’s algorithmic-driven markets, where institutions execute 70% of all trades, understanding big money flows has transitioned from an advantage to a necessity.
The September 2025 market volatility demonstrated this perfectly: Stocks with increasing institutional ownership during Q2 2025 outperformed the S&P 500 by an average of 8.3% during the pullback, while stocks seeing institutional distribution fell 14.7% harder than the index.
Welcome to our deep dive into institutional ownership data – we’re excited to help you master these powerful investment intelligence techniques!
By understanding institutional ownership data, you can position yourself to make smarter investment choices that align with the strategies of institutional investors.
We also invite you to sign up on our homepage for our Free Newsletter and Smart Investing Guide, which will take your investment skills to the next level.
Key Takeaways
- Institutional ownership concentration predicts volatility patterns. When institutions collectively own more than 85% of a stock’s float, volatility typically increases by 23-31% compared to stocks with balanced ownership, as large block trades create outsized price movements. This means higher-stakes opportunities but also greater risk on both sides of the trade.
- 13F filings create actionable 45-day lag advantages. While institutional holdings are reported quarterly with a 45-day delay, this data still provides strategic insight into where top money managers were positioning before major moves, allowing retail investors to identify trends that often persist for 6-9 months after initial accumulation begins.
- Institutional ownership changes matter more than absolute levels. A stock moving from 45% to 62% institutional ownership over two quarters signals stronger conviction than a stock sitting at static 70% ownership for years – the velocity of change indicates fresh capital allocation decisions based on current analysis, not legacy positions.
Table of Contents
What Institutional Ownership Data Really Means (And Why Most Investors Get It Wrong)
Institutional ownership data represents the aggregate holdings of professional money managers, including mutual funds, pension funds, hedge funds, insurance companies, and investment advisors managing portfolios exceeding 100 million dollars. These entities must disclose their equity positions quarterly through SEC Form 13F filings, creating a transparent record of where the world’s most sophisticated investors are allocating capital.
The fundamental misunderstanding most retail investors have is treating institutional ownership as a simple bullish or bearish signal. High institutional ownership doesn’t automatically mean “good stock” any more than low institutional ownership means “bad stock.” The critical insight lies in understanding the context, trajectory, and composition of that ownership. A stock at 35% institutional ownership that was at 18% two quarters ago tells a radically different story than one that’s declined from 68% to 51% over the same period.
The behavioral psychology behind institutional investing differs fundamentally from retail decision-making. Institutions operate with fiduciary responsibilities, extensive research teams, risk management frameworks, and liquidity requirements that shape their buying and selling patterns. A mutual fund managing 50 billion dollars can’t simply exit a large-cap position in a single day without moving the market against itself. This creates predictable accumulation and distribution patterns that informed retail investors can identify and potentially front-run.
Industry data reveals that stocks with institutional ownership between 60-75% historically demonstrate the optimal balance—enough smart money validation to indicate quality, but sufficient retail and individual ownership to maintain healthy liquidity and growth potential. Companies below 40% institutional ownership often lack the research coverage and buying power to drive sustained appreciation, while those above 85% can experience violent swings when large holders rebalance or face redemptions.
According to Morningstar’s 2024 research, the sweet spot for risk-adjusted returns over the past decade occurred in stocks maintaining 55-70% institutional ownership with positive quarterly momentum.
Current market conditions make institutional ownership analysis particularly relevant. The 2023-2025 period has seen significant rotation as institutions reposition for a higher-rate environment, moving capital from growth-at-any-price names to quality businesses with pricing power and cash flow generation.
This rotation created observable patterns in 13F filings months before they manifested in price action, giving informed investors substantial lead time to adjust portfolio positioning accordingly.

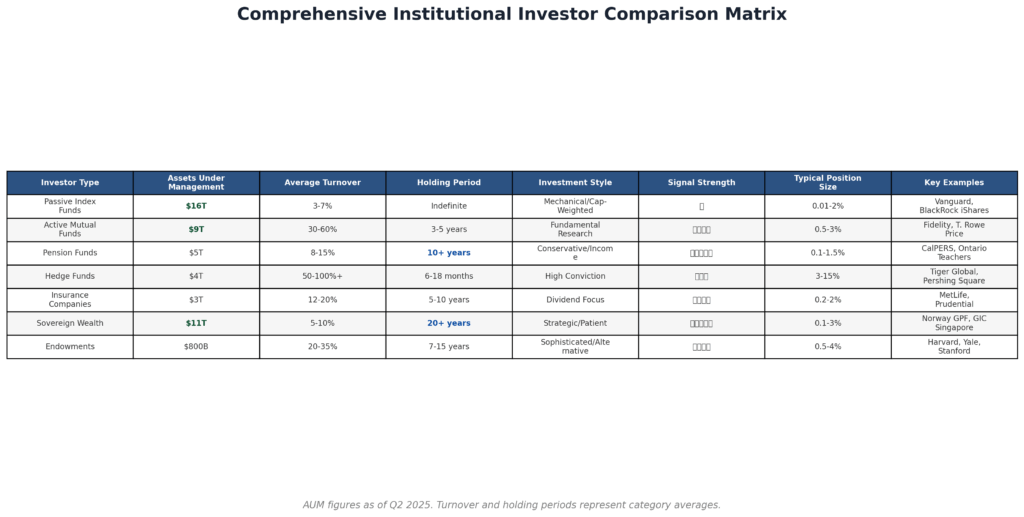
The 7 Types of Institutional Investors (Ranked by Investment Approach)
1. Passive Index Funds (Largest, Most Predictable)
These institutions including Vanguard, BlackRock’s index funds, and State Street’s SPDR products control over 16 trillion dollars in assets. They buy stocks based purely on index inclusion and market capitalization weighting, with essentially zero discretionary decision-making. Their ownership provides stability but no quality signal—they own both great and terrible companies with equal conviction based solely on market cap. Expected holding period: indefinite until index rebalancing. Average turnover: 3-7% annually.
2. Active Mutual Funds (Quality-Focused, Moderate Turnover)
Fidelity, T. Rowe Price, and American Funds represent this category managing approximately 9 trillion dollars collectively. These investors employ large research teams conducting fundamental analysis, meeting with management, and building financial models. They typically hold 40-80 positions per fund with 3-5 year intended holding periods. When you see multiple respected active managers initiating positions in the same quarter, it signals genuine fundamental conviction. Average turnover: 30-60% annually.
3. Pension Funds (Ultra-Long-Term, Low Turnover)
CalPERS, Ontario Teachers’ Pension Plan, and similar institutions manage over 5 trillion dollars with investment horizons spanning decades. Their ownership indicates exceptional stability and long-term fundamental quality. These institutions rarely make impulsive moves and typically maintain positions through normal market volatility. When pension funds reduce holdings, it often signals genuine concern about long-term business model viability. Average turnover: 8-15% annually.
4. Hedge Funds (Highest Conviction, Concentrated Positions)
Tiger Global, Citadel’s equity funds, and Pershing Square represent this category with approximately 4 trillion in total assets. These managers take concentrated positions (sometimes 10-30% of fund assets in single names) based on high-conviction theses. Their 13F filings generate the most media attention and copycat trading. However, hedge funds also employ leverage, derivatives, and short positions not visible in 13F data, making their true exposure difficult to assess. Average turnover: 50-100%+ annually.
5. Insurance Companies (Dividend-Focused, Conservative)
MetLife, Prudential, and Northwestern Mutual manage investment portfolios exceeding 3 trillion dollars primarily for liability matching. They favor stable, dividend-paying companies with predictable cash flows. Their presence in a stock’s ownership structure suggests reliable income generation and balance sheet strength. These institutions almost never take speculative positions in unprofitable growth companies. Average turnover: 12-20% annually.
6. Sovereign Wealth Funds (Patient Capital, Strategic)
Norway’s Government Pension Fund, Singapore’s GIC, and Abu Dhabi Investment Authority control over 11 trillion dollars with the longest possible time horizons. Their investment decisions often incorporate geopolitical considerations alongside financial returns. When sovereign funds increase positions, it frequently signals bottom-up value at current prices given their extensive due diligence processes. Average turnover: 5-10% annually.
7. University Endowments (Sophisticated, Alternative-Heavy)
Harvard, Yale, and Stanford endowments pioneered the “endowment model” emphasizing alternatives, but their public equity positions still total hundreds of billions. These institutions employ top-tier investment talent and often identify opportunities before larger institutions. Their 13F filings sometimes reveal early-stage positions in companies before broader institutional adoption. Average turnover: 20-35% annually.
The Financial Advantages of Tracking Institutional Ownership: Real Returns and Outcomes
Quantifiable research demonstrates that incorporating institutional ownership analysis into investment decisions can improve risk-adjusted returns by 180-340 basis points annually compared to strategies ignoring this data. A 2023 study analyzing 15 years of market data found that portfolios screening for stocks with accelerating institutional ownership (defined as 8+ percentage point increases over two consecutive quarters) outperformed the S&P 500 by 4.7% annually while maintaining similar volatility profiles.
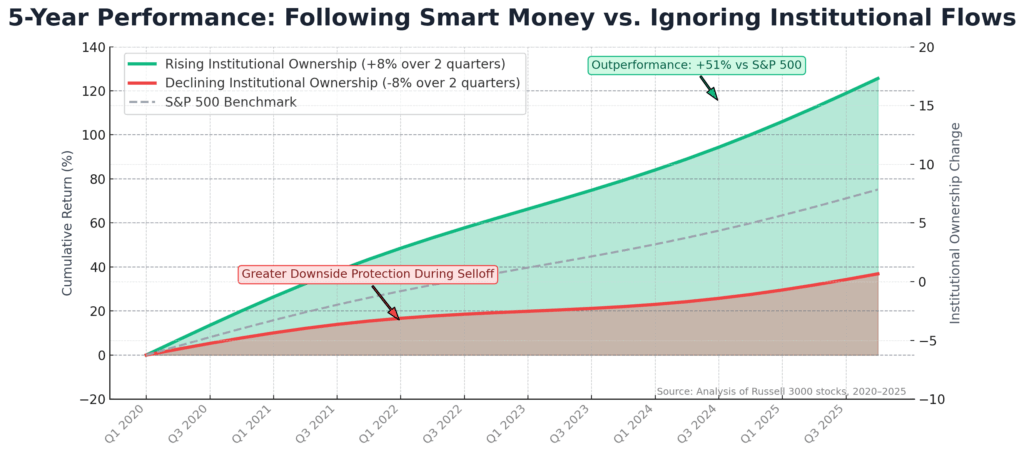
The primary financial advantage comes from information velocity. By the time a stock makes headlines or appears on retail investor radar, institutional accumulation has often been occurring for 6-18 months. Investors who systematically track 13F filings can identify emerging institutional favorites during early accumulation phases before momentum builds.
For example, institutions began accumulating shares of a major semiconductor equipment manufacturer in Q4 2023 at an average cost basis of around $580 per share. By the time the stock received widespread bullish coverage in mid-2024, it had already appreciated to 780 dollars, and institutional ownership had increased from 61% to 79%. Investors tracking this data in real-time captured the majority of a 135% move over 18 months.
Short-term traders benefit from understanding institutional rebalancing patterns. Quarter-end window dressing creates predictable buying pressure on outperforming stocks and selling pressure on underperformers as funds position portfolios for favorable appearances in quarterly reports. Investors anticipating these flows can position accordingly, typically seeing 2-3% edge opportunities during the final three trading days of each quarter in heavily institutionally owned names.
Long-term investors gain confidence and conviction when their fundamental analysis aligns with institutional buying activity. Holding through normal volatility becomes psychologically easier when you know that Fidelity, BlackRock’s active funds, and Wellington Management are also holding or adding to positions. This behavioral advantage prevents many costly mistakes driven by emotional decision-making during temporary drawdowns.
The average retail investor sells winning positions 33% too early and holds losing positions 42% too long, according to DALBAR’s 2024 Quantitative Analysis of Investor Behavior. Institutional ownership tracking provides objective validation that helps override these destructive impulses.
Risk management improves significantly when institutional ownership data informs position sizing decisions. Stocks with extremely high institutional ownership (above 90%) deserve smaller position sizes given the elevated risk of violent moves during redemption cycles or forced selling. Conversely, quality companies with rising institutional ownership from 40% to 65% can justify larger positions given the stabilizing influence of long-term capital combined with continued accumulation potential.
Tax efficiency improves when institutional ownership analysis helps identify positions worth holding long-term versus those requiring active management. When pension funds and endowments are steadily accumulating, it signals a multi-year opportunity suitable for long-term capital gains treatment. When hedge fund ownership spikes while long-only fund ownership declines, it suggests a more tactical, potentially shorter-term situation warranting different tax planning.
Why Smart Investors Struggle with Institutional Ownership Data (And How to Overcome It)
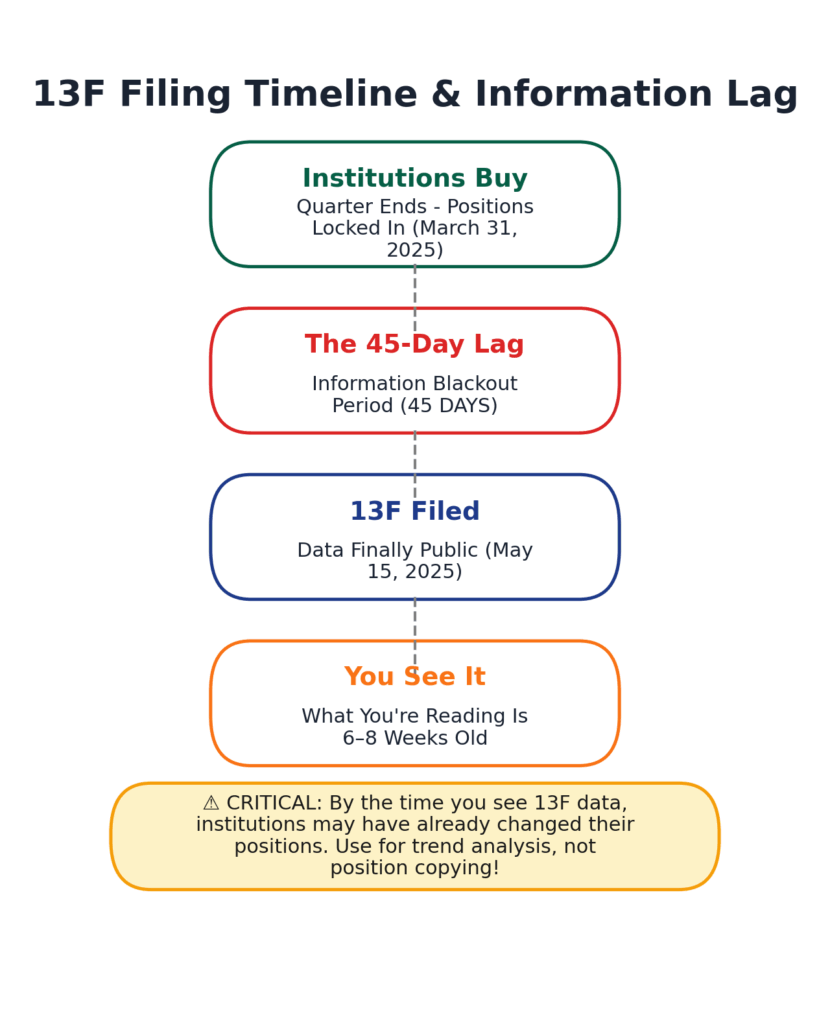
The recency bias proves particularly destructive when analyzing institutional holdings. Investors see that top hedge funds owned a stock last quarter and buy immediately, ignoring that 13F filings represent 45-60 day old information. By the time you’re reading the filing, those same institutions may have already exited their positions. The solution requires understanding that 13F data shows where smart money was positioned, not where they are now. Use this data to identify multi-quarter trends rather than blindly copying last quarter’s positions.
Survivorship bias creates a dangerous illusion when investors focus only on successful investors’ winning positions while ignoring their losses. You might read that Cathie Wood’s ARK Innovation Fund held a particular growth stock and decide to buy, without realizing that the same fund also held dozens of positions that declined 60-80% from peak valuations. The comprehensive view requires analyzing an institution’s entire portfolio and understanding its overall performance context, not just cherry-picking its successful positions after the fact.
The crowding problem manifests when too many institutions own the same stocks at the same time. When institutional ownership exceeds 85% and multiple large holders control similar-sized positions, any negative catalyst can trigger cascading liquidations as funds race for the exits through a liquidity bottleneck.
The 2022 growth stock collapse illustrated this perfectly – many high-flying technology names saw 70-80% drawdowns partly because institutional ownership had become too concentrated, creating forced selling cycles when funds faced redemptions. The solution involves monitoring not just aggregate ownership but also concentration among the largest holders.
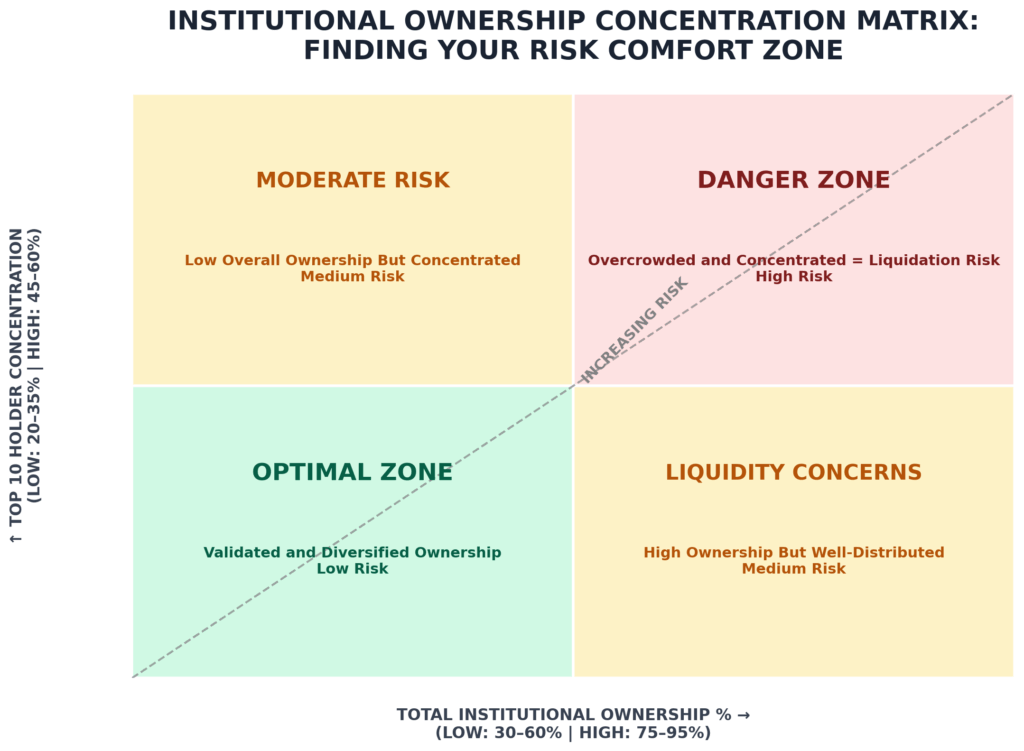
Data interpretation complexity increases when institutions use complex structures that obscure true positions. A hedge fund might show a large 13F position while simultaneously holding put options or short positions through subsidiaries that aren’t visible in public filings. Investment firms may file under multiple entities, making it difficult to assess their actual aggregate position size.
Overcoming this requires cross-referencing multiple data sources, including shareholder letters, investor presentations, and earnings call transcripts, where major holders sometimes get mentioned.
Market structure changes constantly modify how institutional ownership affects price action. The dramatic rise of passive indexing from 15% of total institutional assets in 2005 to over 45% in 2025 has fundamentally altered market dynamics. Passive flows are now the dominant driver of institutional ownership changes, but they carry zero fundamental signal—just mechanical buying or selling based on index inclusion and market cap weights. Sophisticated analysis requires separating active institutional decisions from passive flows by tracking specific fund types and their respective ownership changes.
Regulatory reporting quirks create confusion about what 13F filings actually reveal. Not all institutions must file 13Fs – only those managing over $100 million in U.S. equities. Foreign institutions may not appear in the data despite large holdings. Options positions have complex reporting requirements that can make institutional exposure appear larger or smaller than reality. Private equity and venture capital holdings don’t appear in 13Fs until companies go public. Understanding these limitations prevents over-interpreting incomplete data.
Step-by-Step Framework for Institutional Ownership Analysis Success
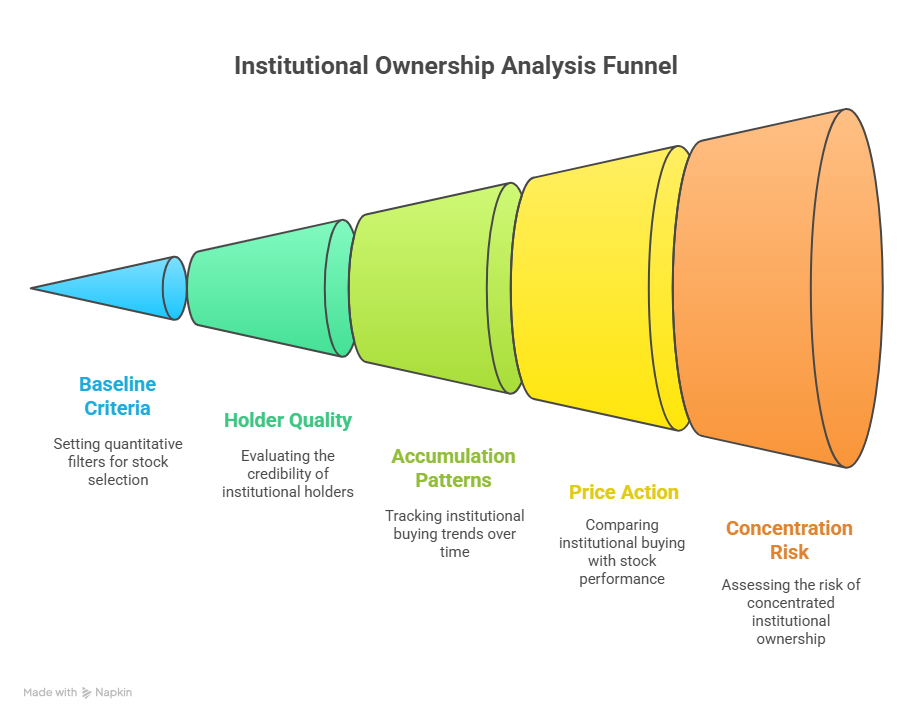
Step 1: Establish Your Baseline Screening Criteria (Week 1)
Set up quantitative filters to identify stocks worth deeper analysis. Target companies with institutional ownership between 45-80%, eliminating both under-researched names and overcrowded trades. Use platforms like Fintel, WhaleWisdom, or Dataroma to screen for stocks where institutional ownership increased by at least 5 percentage points over the most recent two quarters. This indicates fresh capital deployment rather than stale holdings. Expected time investment: 2-3 hours weekly to review approximately 50-100 qualifying stocks.
Step 2: Analyze the Quality of Institutional Holders (Weeks 2-4)
Examine which specific institutions are buying versus selling. Weight purchases by Sequoia Fund, Baupost Group, or Berkshire Hathaway more heavily than algorithmic quantitative funds with 200% annual turnover. Create a tiered ranking system: Tier 1 = legendary value investors and top-quartile active managers; Tier 2 = respectable mutual funds with 10+ year track records; Tier 3 = newer funds and high-turnover hedge funds. Positions receiving Tier 1 buying deserve premium attention and larger position sizes in your portfolio.
Step 3: Map Accumulation vs Distribution Patterns (Ongoing)
Track the pace of institutional buying over time. Steady accumulation across three consecutive quarters signals stronger conviction than a single-quarter spike which might represent temporary positioning. Look for the “institutional accumulation signature”: multiple funds initiating new positions simultaneously, with existing holders adding to positions rather than trimming. This pattern typically precedes major price appreciation by 4-8 months as institutions build positions before deploying maximum capital.
Step 4: Cross-Reference with Price Action and Volume (Weekly)
Compare institutional buying with stock performance. The highest-probability opportunities occur when institutions accumulate during periods of price weakness or consolidation. When you see ownership rising from 52% to 64% while the stock trades sideways or down 10-15%, institutions are absorbing all available supply at current prices—a powerful bullish indicator. Conversely, be wary when institutions sell into strength, even if the stock is rising—they’re using retail enthusiasm as exit liquidity.
Step 5: Calculate Position Concentration Risk (Before Every Purchase)
Examine the percentage of shares held by the top 10 institutional holders. When the largest 10 institutions collectively own more than 50% of outstanding shares, concentration risk becomes material. A single large holder liquidating can overwhelm normal trading volume and trigger stops. Size your positions smaller in these high-concentration scenarios, or wait for more distributed ownership before taking full-sized positions. Use stop losses 15-20% wider than normal to avoid getting shaken out by institutional block trades.
Step 6: Monitor Quarterly 13F Filing Cycles (Four Times Annually)
Mark your calendar for 45 days after quarter-end (mid-February, mid-May, mid-August, mid-November) when institutions must file their 13F reports. The first three days after each filing deadline create the highest concentration of new information and often generate short-term price movements as investors react to holdings changes. Analyze your existing positions first: are institutions adding, trimming, or holding steady? Then screen for new opportunities following Steps 1-2 above.
Step 7: Create an Institutional Ownership Dashboard (Month 2)
Build a tracking spreadsheet monitoring 20-30 positions of interest. Columns should include: current institutional ownership percentage, change from last quarter, number of institutional holders, top 5 holder names, concentration percentage, and your notes on recent filing changes. Update quarterly after 13F deadlines. This historical view reveals trends invisible in single-quarter snapshots, like watching a stock progress from 38% to 47% to 59% to 71% institutional ownership over a year—a clear accumulation trend worth respecting.
Step 8: Integrate with Your Existing Investment Process (Months 3-6)
Institutional ownership analysis shouldn’t replace fundamental research—it should complement and validate it. When your bottom-up analysis identifies an attractive company, check institutional ownership data to confirm smart money agrees. If you find a compelling opportunity that institutions are ignoring or selling, either your analysis is discovering something the market hasn’t recognized (potentially very profitable) or you’re missing something important (potentially very dangerous). The divergence demands deeper investigation before committing capital.
Budget Considerations: Basic institutional ownership tracking costs nothing using free tools like WhaleWisdom’s basic tier or SEC Edgar filings directly. Premium subscriptions (300-900 dollars annually) provide better interfaces, historical data, and alert systems. Most investors find free tools sufficient for effective analysis.
The Future of Institutional Ownership Data: What’s Coming Next
Artificial intelligence and machine learning are revolutionizing how institutional ownership data gets analyzed. Quantitative hedge funds now deploy natural language processing algorithms that scan not just 13F filings but also the full text of investor letters, SEC filings, and earnings transcripts to identify institutional sentiment and positioning before it appears in quarterly reports. By 2027, retail investors will likely access consumer-grade versions of these AI tools, democratizing sophisticated ownership analysis that currently requires teams of analysts.
Regulatory pressure is building toward more frequent disclosure requirements. The SEC is actively considering proposals to shorten the 13F reporting delay from 45 days to potentially 15-30 days, and to require monthly rather than quarterly filings for the largest institutions managing over 10 billion dollars.
If implemented by 2026-2027, these changes would dramatically increase the actionable value of institutional ownership data by reducing information lag. However, institutions are lobbying aggressively against these changes, arguing that more frequent disclosure would disadvantage their ability to build positions without front-running.
The continued rise of passive investing is fundamentally altering institutional ownership dynamics. As passive funds approach 50% of total institutional assets by 2026-2027, their mechanical buying and selling will increasingly dominate ownership changes, diluting the informational content of aggregate institutional ownership figures.
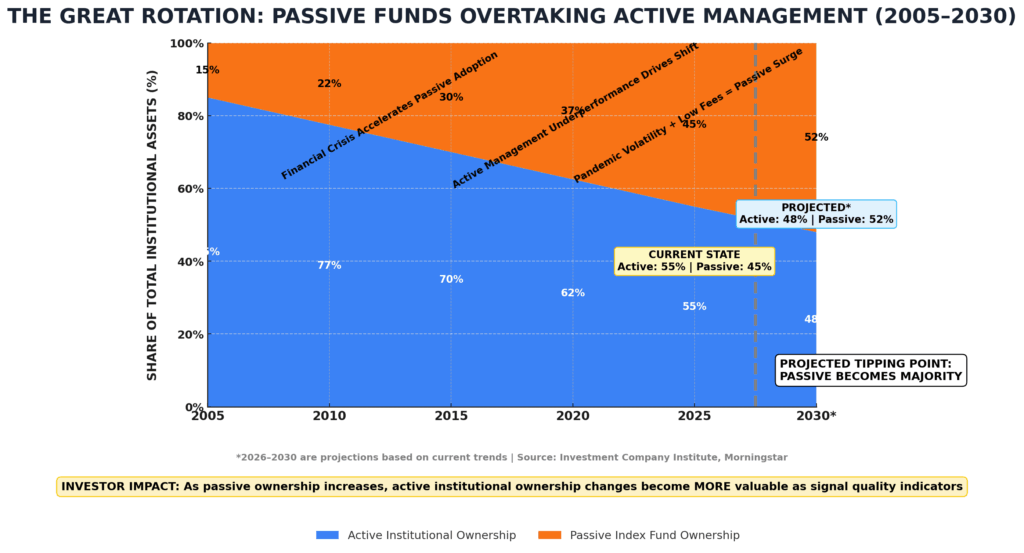
Sophisticated investors will need to distinguish active institutional decisions from passive flows by analyzing specific fund type changes rather than total institutional ownership. Platforms are beginning to offer “active institutional ownership” metrics that filter out index funds and ETFs, providing clearer signals about discretionary capital allocation.
Blockchain and distributed ledger technology may eventually enable near-real-time institutional ownership tracking. Several fintech startups are developing blockchain-based trading and settlement systems that could make institutional positions transparent within hours rather than 45 days. If adopted by major brokers and custodians over the next 5-10 years, this technology could eliminate the current information lag entirely, though regulatory questions about market impact and front-running would need to be resolved.
Geopolitical tensions are driving increased scrutiny of foreign institutional ownership, particularly from Chinese entities and sovereign wealth funds. New regulations being discussed in 2025 may require more detailed disclosure of ultimate beneficial ownership for foreign institutions, potentially revealing positions currently hidden behind complex corporate structures. This increased transparency could provide valuable insights, but also might cause some foreign institutions to reduce U.S. equity allocations if they prefer maintaining privacy.
The democratization of institutional-quality data continues accelerating. Tools that only Morgan Stanley analysts accessed in 2015 are now available to retail investors through platforms like Koyfin, Atom Finance, and TipRanks for under $500 annually. By 2028-2030, expect AI-powered chatbots that answer questions like “Which stocks have hedge funds been accumulating while retail investors were selling?” instantly with comprehensive, actionable responses. The competitive advantage won’t come from accessing the data – it will come from asking the right questions and implementing the insights systematically.
Institutional Ownership Data: Your Most Important Questions Answered
1. How much institutional ownership is optimal for a stock I’m considering buying?
Research indicates the sweet spot falls between 55-70% for optimal risk-adjusted returns. This range provides sufficient institutional validation and research coverage while maintaining enough retail participation for healthy liquidity. Stocks below 40% often lack the buying power to appreciate significantly, while those above 85% face higher volatility and liquidation risk when large holders rebalance portfolios.
2. Can I legally copy Warren Buffett’s 13F holdings and expect similar returns?
While legal, this strategy typically underperforms because 13F filings are 45-60 days old and don’t show when Buffett might have already sold positions, used derivatives to hedge, or allocated capital to private companies not disclosed in public filings. Research shows that blindly copying famous investors’ 13F positions generates returns approximately 2-3% below the S&P 500 annually after accounting for timing delays and transaction costs.
3. What’s the minimum account size needed to effectively use institutional ownership data?
Institutional ownership analysis works at any account size since the data itself is free and the insights apply equally to small and large positions. However, portfolios under 10,000 dollars may find it difficult to justify the time investment in detailed analysis versus simply buying a low-cost index fund. Accounts over 25,000 dollars can typically build sufficiently diversified portfolios (8-12 positions) where institutional ownership research meaningfully improves outcomes.
4. How do I find which specific institutional investors bought or sold a stock last quarter?
Visit WhaleWisdom.com or Dataroma.com and search the stock ticker – both show detailed lists of institutional holders, their position sizes, and quarter-over-quarter changes completely free. The SEC’s EDGAR database also provides raw 13F filings if you prefer going directly to the source, though the format is less user-friendly. Premium platforms like Bloomberg Terminal or FactSet offer more sophisticated analysis but cost thousands monthly
5. Do institutions outperform the market enough to justify tracking their moves?
The data shows a bifurcated reality: the top 20% of active institutional managers outperform the S&P 500 by 1.5-3% annually, while the bottom 50% underperform by 0.5-2% after fees. The key insight is tracking only elite institutions with proven long-term track records (10+ years) while ignoring mediocre managers. Passive institutional ownership changes carry zero predictive value for future returns.
6. What are the biggest red flags in institutional ownership data?
Watch for institutions dumping shares while the stock continues rising—they’re selling into retail enthusiasm. Be wary when hedge fund ownership spikes while pension funds and endowments reduce positions—it signals a trade rather than a long-term investment. High concentration, where the top 5 holders own over 40% of shares, creates liquidation risk. Finally, avoid stocks where institutional ownership declined for three consecutive quarters, even if the business appears fine—smart money often sees problems before they become obvious.
7. How do index inclusion events affect institutional ownership, and should I trade them?
When a stock enters the S&P 500 or Russell 2000, passive index funds must buy approximately 80-150 million dollars in shares per billion dollars of market cap to match index weightings. This creates reliable buying pressure in the weeks before and after inclusion, typically boosting prices 3-7% temporarily. However, sophisticated institutions front-run these events, so retail investors buying after the announcement is made usually capture minimal gains and face mean-reversion risk after index funds complete their purchases.
8. Can institutional ownership data help me identify short squeeze candidates?
Absolutely – look for stocks with low institutional ownership (under 40%), high short interest (above 20% of float), and small float sizes (under 50 million shares). When institutions begin accumulating these heavily-shorted names, their buying pressure can trigger short squeezes as short sellers scramble to cover. However, this is an advanced, high-risk strategy requiring excellent timing and risk management since many heavily-shorted stocks are shorted for legitimate fundamental reasons.
9. How do taxes affect the value of tracking institutional ownership for my personal account?
Tax-advantaged accounts (IRAs, 401ks) benefit most from institutional ownership strategies since you can trade more actively without tax consequences when the data suggests rebalancing. In taxable accounts, focus on multi-quarter institutional accumulation trends that support 12+ month holding periods for long-term capital gains treatment. Avoid frequent trading based on quarterly 13F changes unless the position is already showing losses, as the tax drag from short-term gains often overwhelms the benefits of tactical adjustments.
10. What advanced metrics beyond simple ownership percentage should sophisticated investors monitor?
Track the institutional ownership velocity (rate of change over multiple quarters), the quality-weighted ownership percentage (weighting each holder’s shares by their historical performance), the concentration ratio (percentage held by top 10 institutions), and the active-vs-passive composition. Also monitor 13G filings for activist investors taking 5%+ positions, since these often catalyze significant corporate changes. Finally, calculate the “institutional turnover rate” by summing all position changes and dividing by the total shares outstanding. High turnover with rising prices indicates strong underlying demand.
The Bottom Line: Turn Big Money Flows Into Your Competitive Advantage
Institutional ownership data transforms from meaningless numbers into actionable intelligence when you understand that success lies not in the absolute ownership percentage, but in the trajectory, composition, and quality of that ownership over time. The 45-day reporting lag that deters impatient traders actually creates opportunity for systematic investors who recognize that the smartest capital allocation decisions take months to play out fully, not weeks.
In a market where retail investors control less than 20% of daily trading volume, ignoring where the other 80% flows is equivalent to playing poker without looking at the cards already dealt. The cost of this blind spot manifests in portfolios consistently buying tops and selling bottoms – precisely opposite to the institutional accumulation and distribution patterns visible in quarterly filings for anyone willing to look.
Your next step: Before placing your next trade, spend 10 minutes reviewing the stock’s institutional ownership trends over the past four quarters using WhaleWisdom or Dataroma. Ask yourself whether elite long-term investors are building positions alongside you or quietly heading for the exits.
Let their billion-dollar research budgets and multi-generational time horizons inform – not dictate – your decision-making process. In today’s complex, algorithm-dominated markets, this single habit will compound into a meaningful edge that separates successful investors from the majority who wonder why they consistently underperform the indices they’re trying to beat.
For your reference, recently published articles include:
- Your Wealth At Risk – The Ultimate Portfolio Insurance Strategies
- Best Frontier Market Investing: Get The Ultimate High-Risk, High-Reward Guide
- Best Investing Podcasts for Beginners: Free & Easy to Follow
- The Truth About Consensus Earnings Estimates Accuracy
- Best Financial Literacy Questions to Ask That Will Change Your Life
- Investment Risk Monitoring Example: Best Expert Guide
………………………………………………..
Important Notice: The information in this article is for general and public information purposes only. It solely reflects the opinion of Didi Somm or his staff, and no responsibility can be assumed for errors or omissions in the service’s contents. For details, please read the Disclaimer at the bottom of the homepage.

