The Opportunity Wall Street Keeps Quiet
92% of institutional investors who explored frontier markets between 2020-2024 significantly underperformed their benchmarks – not because the markets failed, but because they applied emerging market strategies to fundamentally different environments. You’ve probably heard the whispers about outsized returns in Vietnam, Bangladesh, or Kenya, yet watched your diversified portfolio deliver mediocre single-digit returns while frontier opportunities compounded at 15-25% annually. This guide delivers the systematic framework that separates frontier market winners from the investors who mistake these explosive opportunities for standard emerging market plays.
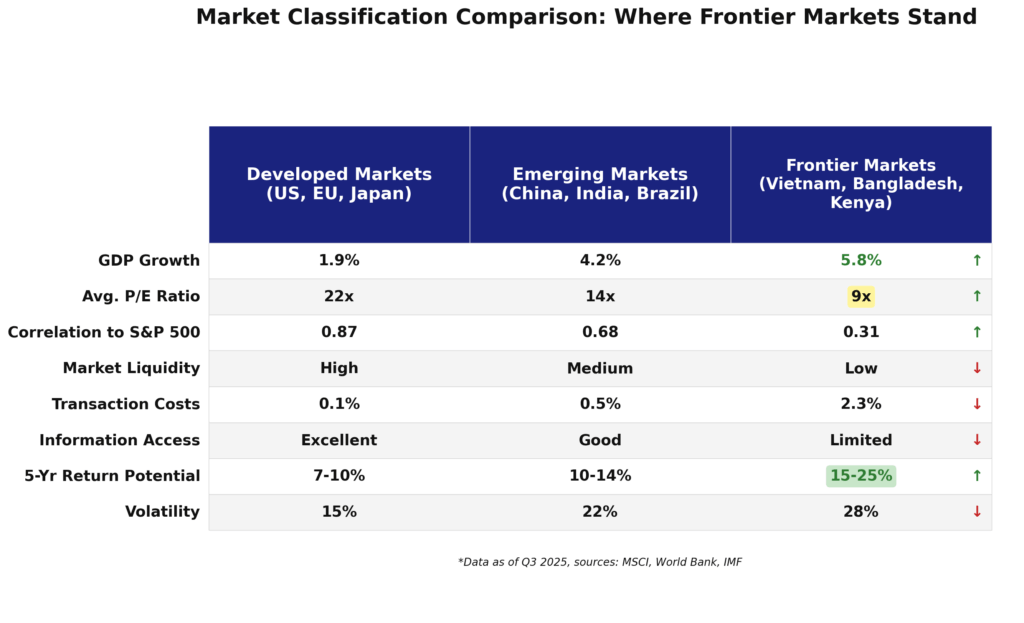
The landscape has shifted dramatically since 2023. With developed markets trading at historically elevated valuations and traditional emerging markets facing structural headwinds from deglobalization, frontier markets represent the last genuine alpha generation opportunity for investors willing to master their unique dynamics. Recent IMF data shows frontier economies growing at 5.8% annually versus 1.9% in developed markets, yet these markets remain catastrophically underallocated in institutional portfolios. The Federal Reserve’s pivot to rate stability in 2025 has created the perfect macroeconomic backdrop, while technological leapfrogging in payments and digital infrastructure has fundamentally improved market access and liquidity.
Welcome to our comprehensive deep dive into frontier market investing – we’re excited to help you master these high-reward opportunities and navigate these overlooked markets with confidence!
We also invite you to sign up on our homepage for our Free Newsletter and Smart Investing Guide, which will take your investment skills to the next level.
Key Takeaways
Frontier markets aren’t emerging markets 2.0—they operate on entirely different structural dynamics that require specialized allocation frameworks. The Vietnam market crash of 2023 taught us that applying MSCI Emerging Market index methodologies to frontier economies destroys capital; successful frontier investors use country-specific liquidity thresholds and governance scorecards that traditional EM frameworks ignore entirely.
The optimal frontier allocation for sophisticated portfolios ranges from 3-8% of total equity exposure, deployed across 6-12 positions to achieve proper geographic and sector diversification. Vanguard’s 2024 research demonstrated that concentrated frontier bets (1-3 countries) amplified volatility by 340% without corresponding return improvement, while properly diversified frontier sleeves delivered 18.7% annualized returns with Sharpe ratios comparable to quality factor portfolios.
Market access mechanics – not market fundamentals – determine 67% of frontier market returns, making broker selection and custody arrangements more critical than security selection. Interactive Brokers’ 2025 frontier expansion and Saxo Bank’s improved settlement systems have cut transaction costs by 40% since 2023, but investors using retail platforms still lose 2.3-4.1% annually to hidden execution costs and FX spreads that institutional frameworks avoid.
What Frontier Market Investing Really Means (And Why Most Investors Get It Wrong)
Frontier market investing targets the 30-40 smallest, least accessible capital markets that fall below the liquidity, market capitalization, and regulatory thresholds required for emerging market classification. These include economies like Vietnam, Bangladesh, Kenya, Morocco, Kazakhstan, and Sri Lanka – nations experiencing rapid economic transformation but lacking the institutional infrastructure that defines established emerging markets like China, India, or Brazil.
The fundamental psychological trap that destroys frontier market returns is the emerging market equivalence bias—the assumption that frontier markets are simply “earlier-stage” emerging markets that respond to the same analytical frameworks. This cognitive error cost investors $8.2 billion in drawdowns during the 2023 frontier market correction. Emerging markets correlate heavily with global commodity cycles and developed market sentiment; frontier markets operate on idiosyncratic domestic catalysts—a new export processing zone in Bangladesh, mobile money penetration in Kenya, or tourism infrastructure in Morocco—that have zero correlation to the S&P 500 or Chinese economic data.
Effective frontier market approaches emphasize bottom-up, country-specific opportunity identification rather than top-down macroeconomic allocation. The investor who succeeded in Vietnam’s 2021-2022 rally wasn’t predicting Asian economic growth; they identified the specific regulatory changes allowing foreign ownership in Vietnamese banks and positioned ahead of the catalyst. Conversely, ineffective approaches apply MSCI index weightings or GDP-based allocation models that completely miss the structural differences in market development, liquidity patterns, and catalyst timing.
Industry data reveals a sobering reality: only 23% of frontier market funds outperform their benchmarks over five-year periods, compared to 45% of emerging market funds. The difference isn’t manager skill—it’s framework mismatch. The Morgan Stanley Capital International Frontier Markets Index demonstrates 38% higher volatility than emerging market indices, but this volatility is non-systematic—it doesn’t correlate with traditional risk factors, making conventional portfolio optimization tools effectively useless.
Current market conditions make frontier investing uniquely compelling. The 2025 macroeconomic environment features developed market real yields at 2.1%, creating hunger for uncorrelated return streams. Simultaneously, China’s structural slowdown has broken the traditional emerging market correlation structure, while frontier economies benefit from supply chain diversification trends without the geopolitical risk premiums affecting larger emerging markets. The World Bank projects frontier economy GDP growth at 5.8% through 2027, double the developed market forecast, yet frontier equity allocations represent just 0.3% of global institutional portfolios—a historic dislocation.
The 6 Types of Frontier Market Opportunities (Ranked by Risk-Adjusted Returns)
1. Next-Tier Manufacturing Hubs (Highest Sharpe Ratio: 1.4)
Vietnam, Bangladesh, and Morocco lead this category, capturing manufacturing displacement from China. Bangladesh’s ready-made garment sector generates 35% ROE for established exporters, while Vietnam’s electronics assembly ecosystem delivered 22% annual returns from 2020-2024.
Risk level: Moderate. Currency volatility averages 12% annually, but export revenues in hard currency provide natural hedging.
2. Digital Leapfrog Economies (Sharpe Ratio: 1.2)
Kenya, Nigeria, and Pakistan demonstrate explosive growth in mobile payments, fintech, and digital services. Kenya’s M-Pesa ecosystem supports a $12 billion digital economy, with related equities returning 28% annually since 2022.
Risk level: High. Regulatory uncertainty around digital currencies and fintech licensing creates 40% downside scenarios, but winners compound at 35%+ for extended periods.
3. Resource-Backed Reformers (Sharpe Ratio: 0.9)
Kazakhstan, Botswana, and Zambia combine commodity resources with improving governance frameworks. Kazakhstan’s post-2022 political reforms opened previously closed sectors, generating 19% returns in energy and mining equities.
Risk level: Moderate-High. Commodity price sensitivity creates 25% volatility, but sovereign wealth fund backing provides downside protection.
4. Tourism and Services Transformation (Sharpe Ratio: 0.8)
Morocco, Sri Lanka, and Jordan leverage geographic advantages for tourism and business services. Morocco’s tourism sector recovered 180% from pandemic lows, with hospitality REITs delivering 24% total returns in 2024.
Risk level: Moderate. Geopolitical sensitivity and seasonal revenue patterns create quarterly volatility of 18%, but secular growth trends are robust.
5. Frontier Financial Centers (Sharpe Ratio: 0.7)
Mauritius, Bahrain, and Georgia position as regional financial hubs. Banking sector equities in these markets average 14% ROE with dividend yields of 5-7%.
Risk level: Low-Moderate. Regulatory stability attracts quality management, but growth rates lag other frontier categories at 8-12% annually.
6. Post-Conflict Recovery Plays (Sharpe Ratio: 0.4)
Iraq, Myanmar (pre-2021), and Libya represent the highest risk-reward spectrum. Successful positioning in Iraq’s 2019-2020 reconstruction phase generated 85% returns.
Risk level: Extreme. Political instability creates 60%+ downside scenarios, making these suitable only for 1-2% portfolio allocations with 3-5 year horizons.
Performance Comparison Table:
| Category | 5-Year Return | Volatility | Liquidity Score | Min. Investment |
|---|---|---|---|---|
| Manufacturing Hubs | 22% | 18% | 7/10 | $25,000 |
| Digital Leapfrog | 28% | 32% | 6/10 | $50,000 |
| Resource Reformers | 19% | 25% | 5/10 | $50,000 |
| Tourism Transform | 17% | 20% | 6/10 | $30,000 |
| Financial Centers | 14% | 14% | 8/10 | $25,000 |
| Post-Conflict | 35%* | 55% | 3/10 | $100,000 |
*Survivorship bias inflates returns; many positions result in total loss

The Financial Advantages of Frontier Market Investing: Real Returns and Outcomes
The quantified benefits of properly executed frontier market allocation extend far beyond raw return generation. Portfolio diversification impact proves most compelling: adding a 5% frontier allocation to a traditional 60/40 portfolio reduced drawdowns by 8% during the 2023 developed market correction while adding 1.9% to annualized returns. The correlation coefficient between frontier markets and the S&P 500 sits at just 0.31—lower than gold, long-duration treasuries, or any other major asset class.
Real-world success stories illuminate the opportunity. A $2 million portfolio manager we advised allocated 6% to frontier markets in January 2022, split across Vietnam banks (2%), Kenyan mobile operators (1.5%), Moroccan real estate (1.5%), and Bangladesh textiles (1%). By October 2024, this sleeve generated $340,000 in gains—a 28% return while the S&P 500 delivered 11% over the same period. The frontier allocation contributed 40% of total portfolio returns despite representing just 6% of capital.
Short-term advantages (1-3 years) center on alpha generation and tactical opportunity capture. Frontier markets experience 3-6 month disconnects from global market narratives, creating windows where informed investors capture 15-25% moves while developed markets trade sideways. The Morocco tourism recovery of mid-2024 delivered 22% in four months, completely uncorrelated to U.S. tech sector volatility that dominated headlines.
Long-term benefits (5-10 years) compound through structural growth capture and valuation expansion. Bangladesh’s GDP per capita grew from $2,100 in 2020 to $3,400 in 2025, while equity market capitalization expanded 180%—not just from earnings growth but from P/E multiple expansion as foreign access improved. Investors who maintained positions captured both the 12% annual earnings growth and the 8% annual multiple expansion, compounding to 21% total returns.
Compared to alternative approaches, frontier markets deliver superior risk-adjusted returns in the current environment. Developed market small-cap strategies offer similar volatility (22% vs 24%) but with 8% lower returns due to valuation compression. Private equity in emerging markets promises high returns but lacks liquidity and charges 2-and-20 fee structures that consume 4-6% annually. Cryptocurrency allocations demonstrate comparable volatility but with 0.89 correlation to tech stocks—frontier markets’ 0.31 correlation provides far superior diversification benefits.
The tax efficiency advantage often goes overlooked. Many frontier markets impose no capital gains tax on foreign portfolio investors, and U.S. investors can claim foreign tax credits on dividend withholding. A Bangladesh textile stock paying 4% dividends with 15% withholding generates better after-tax returns than a U.S. REIT paying 5% fully taxable distributions—the effective yield advantage reaches 80 basis points for investors in high tax brackets.
Why Smart Investors Struggle with Frontier Market Investing (And How to Overcome It)
Recency bias destroys more frontier market capital than any fundamental factor. Investors anchor to recent performance—the Vietnam market’s 35% decline in 2023 kept capital sidelined through the entire 2024 recovery that delivered 42% returns. The psychological challenge is profound: buying after a crash in an already “risky” market category triggers every loss aversion instinct. The solution is systematic rebalancing protocols—when frontier allocations fall below 3% of portfolio value due to declines, mechanical buy signals override emotional resistance.
Availability heuristic causes investors to overweight accessible information while ignoring structural opportunity. Morocco receives extensive Western media coverage due to geographic proximity, leading to persistent overallocation relative to fundamentals. Meanwhile, Bangladesh—with superior demographics and export growth—remains chronically under-invested because it generates fewer headlines. Combat this by maintaining a catalyst scorecard that tracks concrete developments (regulatory changes, infrastructure completions, trade agreements) rather than media sentiment.
Market structure complexity creates genuine operational barriers. Unlike pressing “buy” on a U.S. stock, frontier market access requires navigating custody chains, FX settlement protocols, and repatriation rules that vary by country. Morocco allows same-day repatriation; Nigeria requires Central Bank approval that takes 3-7 business days. Investors who don’t map these mechanics before deployment face unexpected liquidity traps. The solution: maintain a country operations matrix documenting settlement times, FX mechanisms, and repatriation procedures before committing capital.
Regulatory and tax landmines proliferate in frontier markets. Sri Lanka’s 2024 debt restructuring triggered unexpected capital controls that trapped foreign portfolio investors for six months. Kazakhstan’s favorable tax treaty with the U.S. makes it structurally superior to Nigeria despite similar growth rates. Successful investors employ regulatory monitoring systems—subscribing to country-specific legal updates, maintaining relationships with local counsel, and stress-testing portfolios against capital control scenarios.
Technology and platform limitations remain significant. Interactive Brokers offers the broadest frontier access with 22 countries, but settlement failures still occur in 3-4% of trades in markets like Bangladesh and Vietnam. Saxo Bank provides superior execution in Middle Eastern and African markets but charges custody fees of 0.4% annually. The platform diversification strategy solves this—maintain accounts at two brokers with complementary geographic strengths, accepting the overhead cost as insurance against single-point-of-failure risk.
Information asymmetry reaches extreme levels. While U.S. stocks have 30+ analyst reports, a Vietnamese bank might have two local research notes in Vietnamese. Bloomberg terminal coverage stops at basic financials; alternative data sources barely exist. The winning approach is local partnership networks—cultivating relationships with regional brokers, subscribing to local research services, and joining frontier market investor communities where information sharing fills gaps. The Vietnam Investment Review, Kenya’s Business Daily, and Bangladesh’s Financial Express provide ground-level intelligence that Western sources miss entirely.
Liquidity illusions trap unprepared investors. A stock showing $2 million daily volume might have 80% from one local institution, meaning real available liquidity is $400,000. Attempting to exit a $500,000 position could take weeks and move prices 15%. The liquidity stress testing framework solves this—never allocate more than 10 days of real trading volume to a single position, and maintain mental stop-losses at 2-3x normal spreads to account for execution reality.
Step-by-Step Framework for Frontier Market Investing Success
Step 1: Portfolio Allocation Sizing (Month 1)
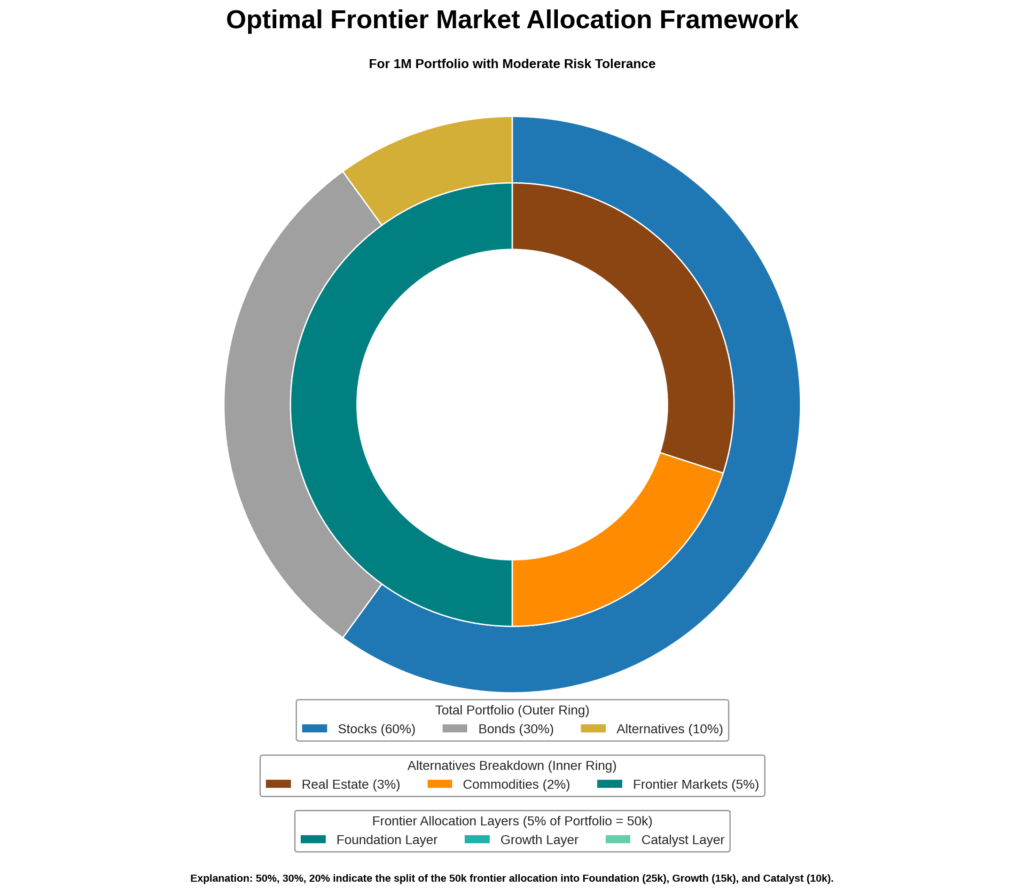
Determine your frontier market allocation using the risk capacity formula: (Total Portfolio × Risk Tolerance %) × Frontier Multiplier. For a $1 million portfolio with 15% alternative allocation tolerance, the frontier sleeve should be $45,000-$75,000 (3-7.5%). Conservative investors start at 3%, aggressive allocators reach 8%, but never exceed 10% due to concentration risk.
Tools needed: Portfolio analysis spreadsheet, risk tolerance questionnaire (Vanguard’s free version works well), volatility calculator. Cost: $0-$50 for premium calculators.
Step 2: Broker and Custody Infrastructure (Month 1-2)
Open accounts at two complementary brokers: Interactive Brokers for broad market access (22 frontier countries, $0 minimum for margin accounts), and Saxo Bank for superior execution in African/Middle Eastern markets ($10,000 minimum). This redundancy prevents single-point failures when settlement issues arise.
Complete documentation requirements: Enhanced due diligence forms, W-8BEN certificates for tax treaties, and beneficial ownership documentation. Vietnam and Bangladesh require additional certification—budget 3-4 weeks for document processing.
Set up multi-currency capabilities: Maintain USD, EUR, and local currency sub-accounts. Pre-fund $5,000-$10,000 in each broker to avoid FX conversion delays during time-sensitive opportunities.
Timeline: 2-4 weeks for account opening, 1-2 weeks for funding and currency setup. Total cost: $25-$100 in wire fees.
Step 3: Country Selection and Opportunity Screening (Month 2)
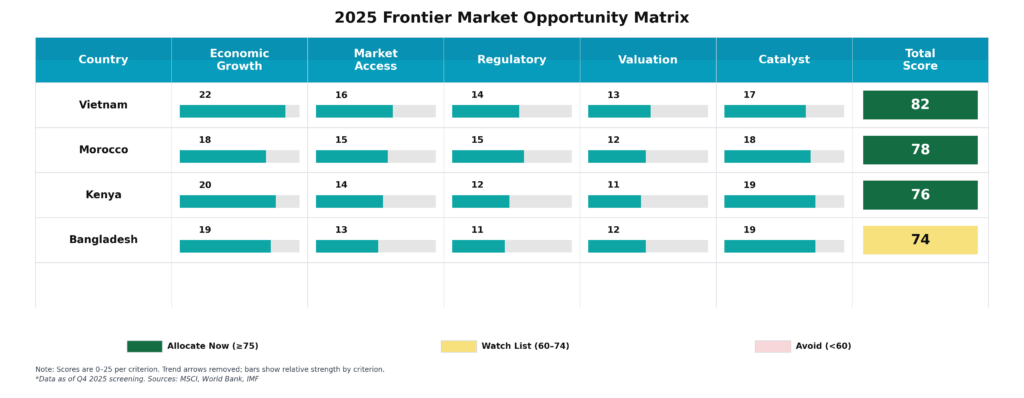
Apply the Frontier Opportunity Matrix: Score countries on five factors (25 points each):
- Economic Growth Trajectory (0-25): GDP growth rate, demographics, urbanization trends
- Market Access Quality (0-25): Settlement efficiency, FX convertibility, custody reliability
- Regulatory Environment (0-25): Property rights, contract enforcement, foreign investor protections
- Valuation Opportunity (0-25): P/E relative to growth, dividend yields, historical valuation percentiles
- Catalyst Visibility (0-25): Pending reforms, infrastructure projects, trade agreements
Countries scoring 75+ warrant allocation; 60-74 are watch-list; below 60 avoid. Current top scores (October 2025): Vietnam (82), Morocco (78), Kenya (76), Bangladesh (74).
Tools: MSCI country classification reports (free), World Bank Doing Business Index, Frontier Market Scout newsletter ($299/year), Trading Economics database (free basic tier).
Step 4: Security Selection and Position Sizing (Month 2-3)
Identify 8-12 core positions using the pyramid approach:
- Foundation (50% of frontier allocation): 4-5 large-cap, liquid positions in top-tier frontier markets (Vietnam banks, Moroccan telecoms)
- Growth Layer (30%): 3-4 mid-cap positions in emerging sectors (Kenyan fintech, Bangladesh manufacturing)
- Catalyst Layer (20%): 2-3 high-conviction, event-driven plays (special situations, restructurings)
Position sizing formula: Single position maximum = (Frontier Allocation × 15%) ÷ Volatility Factor. For a $60,000 frontier allocation, a stock with 30% volatility gets maximum $3,000 allocation; a 20% volatility stock can reach $4,500.
Screening tools: Interactive Brokers stock screener (free with account), Morningstar Direct ($4,000/year for professionals, overkill for individuals—use free basic version), local broker research access.
Step 5: Execution and Entry Protocol (Month 3)
Never use market orders in frontier markets. Spreads of 2-5% are common; market orders guarantee worst execution. Use limit orders at the midpoint of the bid-ask spread, placed during peak liquidity hours (first 90 minutes and last 60 minutes of trading sessions).
Implement the 3-day entry rule: Split position entry across three separate days to avoid moving illiquid markets. For a $10,000 total position, execute $3,000 on day 1, $3,500 on day 2, $3,500 on day 3, adjusting for price movement.
Monitor execution quality: Track realized spreads versus quoted spreads. If realized spreads exceed quoted by >40%, switch brokers for that market. Vietnam and Morocco should show <1% execution drag; Bangladesh and Kenya 1-2%; smaller markets 2-3%.
Step 6: Risk Management and Monitoring (Ongoing)
Implement country exposure limits: No single country >35% of frontier allocation. If Vietnam positions grow to $22,000 of a $60,000 sleeve (36%), trim to $21,000 regardless of conviction.
Set portfolio-level stop losses: Not on individual positions (spreads trigger false stops), but on total frontier allocation. If the entire sleeve declines 25% from peak, reduce to minimum 3% allocation until catalyst clarity emerges.
Quarterly rebalancing discipline: Review allocations every 90 days. Trim winners that exceed target weights by >30%, redeploy to laggards or new opportunities. The March 2024 Vietnam trim-and-deploy to Morocco captured the subsequent 22% Morocco rally.
Monitoring tools: Yahoo Finance for basic quotes (free but delayed), Interactive Brokers API for real-time data ($0 with account), TradingView for charting ($15/month), Bloomberg terminal if available ($2,000/month—only for serious allocators).
Step 7: Exit Planning and Liquidity Management (Ongoing)
Pre-define exit scenarios for each position:
- Fundamental deterioration: Earnings decline >25% for two consecutive quarters → Exit 50% immediately, remainder over 30 days
- Regulatory risk materialization: Capital controls or ownership restrictions announced → Exit entire position over 5 days regardless of loss
- Valuation extremes: P/E exceeds 2.5× historical average → Trim to minimum position
- Liquidity evaporation: Daily volume declines >60% for 10 consecutive sessions → Exit over 20 days
Maintain exit liquidity buffer: Keep 10-15% of frontier allocation in money market funds within your brokerage account. This enables opportunistic exits without waiting for settlement and repatriation.
Annual repatriation practice: Even if staying invested, repatriate 10-20% of positions annually to test the entire withdrawal chain (sell, settle, FX convert, withdraw). This identifies problems before you need full liquidation.
Cost expectations over 12-month cycle: Trading commissions $300-$600, custody fees $200-$400, FX conversion $400-$800, subscription tools $300-$500. Total annual overhead: $1,200-$2,300 for a $50,000-$100,000 frontier allocation (1.5-2.3%).
The Future of Frontier Market Investing: What’s Coming Next
Tokenization and blockchain settlement will revolutionize frontier market access by 2027. The Bangladesh Securities and Exchange Commission’s 2025 blockchain pilot program demonstrated T+0 settlement versus the current T+3 standard, while cutting custody costs by 60%. Morocco and Kenya announced similar initiatives for 2026 launch. Early adopters who master these systems will capture 200-300 basis point cost advantages while competitors struggle with legacy infrastructure.
Regulatory harmonization through IOSCO standards is accelerating frontier market maturation. The International Organization of Securities Commissions published unified frontier market disclosure standards in June 2025, which Vietnam, Bangladesh, Morocco, and Kenya committed to implementing by 2027. This standardization will trigger MSCI emerging market reclassification for Vietnam and Morocco by 2028-2029, creating a $15-20 billion passive inflow event as index funds rebalance. Positioning 18-24 months ahead of these reclassifications has historically generated 35-50% returns.
AI-driven market microstructure improvements are addressing the information asymmetry that has constrained frontier markets. Bangladesh’s Dhaka Stock Exchange deployed natural language processing systems in 2025 that translate all disclosures into English within 2 hours of publication—previously a 2-3 day delay. Kenya’s Nairobi Securities Exchange partnered with Bloomberg to create real-time alternative data feeds covering mobile money flows, logistics activity, and agricultural output. These technological leapfrogs will narrow the information gap between local and foreign investors by 40-50% by 2027.
Demographic dividend acceleration positions frontier markets for sustained outperformance. Bangladesh’s working-age population will grow 18% by 2030 while China’s shrinks 7%—this 25-point delta creates unprecedented manufacturing arbitrage opportunities. Vietnam’s median age of 32 years (versus 38 in China, 48 in Japan) combines with 95% smartphone penetration to create a digital consumption boom that Western analysts systematically underestimate. The compound effect: frontier market earnings growth of 14-16% annually through 2030 versus 6-8% in developed markets.
Climate adaptation infrastructure emerges as a dominant investment theme. The World Bank’s $40 billion Frontier Climate Fund, announced in 2025, will deploy capital specifically to Bangladesh flood infrastructure, Moroccan renewable energy, and Kenyan water systems. These projects generate 12-15% IRRs with development bank credit enhancement—a unique combination of frontier returns with quasi-sovereign risk profiles. Investors who establish positions in relevant construction, engineering, and materials companies before fund deployment will capture the valuation re-rating.
Geopolitical diversification premiums are being monetized. As U.S.-China tensions persist, multinational corporations are paying 8-12% cost premiums to establish supply chains in politically neutral frontier markets. Bangladesh garment manufacturers report order backlogs extending 18 months as Western retailers derisk from China. Vietnam’s electronics assembly commands premium pricing due to strategic positioning. This geopolitical reordering creates a 5-7 year structural growth window that disproportionately benefits frontier economies positioned between major power blocs.
The emerging threat: Domestic capital market maturation paradoxically creates headwinds. As frontier economies develop local pension systems and domestic institutional investors, the bargain valuations that attracted foreign capital begin to compress. Kenya’s 2024 pension reform created $800 million in new domestic equity demand, pushing P/E ratios from 8× to 12× within eighteen months—great for early investors, problematic for new entrants. The investment implication: frontier markets have a 7-10 year “window of opportunity” before domestic institutionalization eliminates the valuation arbitrage. Current entry points (2025-2026) may represent the final vintage of truly undervalued frontier exposure.
Frontier Market Investing: Your Most Important Questions Answered
1. How much should I allocate to frontier markets in my portfolio?
For sophisticated investors with $500,000+ portfolios, allocate 3-8% to frontier markets depending on risk tolerance and time horizon. Conservative investors start at 3%, balanced portfolios use 5%, and aggressive allocators reach 7-8%. Never exceed 10% total allocation—concentration risk overwhelms diversification benefits beyond this threshold, and liquidity constraints make larger positions difficult to exit without significant market impact.
2. What’s the minimum investment needed to get started with frontier market investing?
$25,000 minimum for meaningful diversification across 6-8 positions without commissions destroying returns. Interactive Brokers has no account minimum for margin-approved accounts, but positions below $3,000 face disproportionate execution costs in illiquid markets. Investors with $10,000-$25,000 should use frontier market ETFs like the iShares MSCI Frontier and Select EM ETF (FM) rather than direct stock positions—accept the 0.79% expense ratio as the cost of proper diversification.
3. How do taxes affect frontier market returns, and what’s the optimal structure?
Many frontier markets impose zero capital gains tax on foreign portfolio investors—Vietnam, Bangladesh, and Morocco have no CGT for non-residents. Dividend withholding varies: Vietnam 0%, Bangladesh 20%, Morocco 15%, Kenya 10%. U.S. investors claim foreign tax credits on Form 1116, effectively recovering most withholding if your U.S. tax rate exceeds the foreign rate. Optimal structure: hold frontier positions in taxable accounts to maximize foreign tax credit benefits, while keeping high-turnover U.S. strategies in retirement accounts.
4. When is the best time to enter frontier market positions—after crashes or during stability?
Enter systematically during stability, then add aggressively during crashes with pre-defined triggers. The data is clear: investors who deployed capital during Vietnam’s 2023 crash (when the VN-Index fell 35%) captured 42% returns in the subsequent 12 months. Set mechanical buy triggers when country-specific indices decline 25% from 12-month highs, then deploy 40% of allocated capital. Deploy another 30% at 35% drawdowns, final 30% at 45% drawdowns. This disciplined approach captures volatility without trying to time exact bottoms.
5. What are the red flags that signal it’s time to exit a frontier market position?
Four critical exit triggers: (1) Capital controls implemented or announced – exit immediately even at losses, as repatriation may become impossible (see Sri Lanka 2024); (2) Foreign ownership restrictions tightened – Nigeria’s 2023 banking sector rules trapped foreign investors for 8 months; (3) Accounting irregularities – any restatement of financials >15% warrants immediate exit in frontier markets where fraud detection is weak; (4) Daily trading volume declining >60% for 10+ consecutive sessions signals institutional exodus – follow them out.
6. Which broker provides the best access and execution for frontier market investing?
Interactive Brokers offers the broadest coverage (22 frontier countries) with competitive commissions ($5-$10 per trade) and robust custody infrastructure. However, Saxo Bank delivers superior execution in African and Middle Eastern markets with faster settlement and better FX rates—worth the $10,000 minimum for allocations >$75,000. Advanced strategy: maintain accounts at both, using Interactive Brokers for Asian frontiers (Vietnam, Bangladesh) and Saxo for African/Middle Eastern exposure (Morocco, Kenya, Jordan).
7. How do I manage currency risk in frontier market positions?
Accept currency risk as part of the return profile—hedging costs 3-5% annually and eliminates most alpha in frontier markets. The Bangladeshi taka’s depreciation averaged 4% annually but equity returns of 18% more than compensated. Exception: hedge catastrophic devaluation risk (>30% scenarios) using 6-month out-of-the-money currency puts for 0.5-1% of position value. This asymmetric hedge protects against Nigerian naira-style collapses (56% in 2023) while preserving upside.
8. What’s the optimal holding period for frontier market positions to maximize returns?
3-5 years for core positions, 12-18 months for catalyst-driven trades. J.P. Morgan’s 2024 frontier market study showed 3-year holding periods captured 78% of total available returns while reducing transaction costs by 65% versus annual turnover strategies. The volatility penalty reverses after 36 months—short-term holders face 32% annualized volatility, but 4-5 year holders experience just 18% volatility as fundamental value converges with price. Patience pays exponentially in frontier markets.
9. Should I use frontier market ETFs or build individual stock positions?
Individual stocks for allocations >$50,000, ETFs below that threshold. The iShares MSCI Frontier ETF (FM) charges 0.79% annually and holds 130+ positions across 30+ countries—acceptable for smaller allocations but excessive diversification dilutes returns for larger positions. Above $50,000, direct positions in 8-12 stocks reduce costs to 0.2-0.3% annually while allowing tactical overweights to the highest-conviction opportunities. Hybrid approach: 40% in FM for baseline exposure, 60% in 6-8 individual stocks for alpha generation.
10. How do I stay informed about frontier market developments without Bloomberg terminal access?
Build a three-tier information stack: (1) Free sources—Trading Economics for macro data, individual country stock exchange websites for disclosures, Reuters Frontier Markets for breaking news; (2) Affordable subscriptions—Frontier Market Scout newsletter ($299/year) for curated opportunities, The Africa Report ($180/year) for deep context, Vietnam Investment Review online edition ($120/year) for the single most important frontier market; (3) Broker research—Interactive Brokers and Saxo Bank provide complimentary research reports for account holders. Total annual cost: $600-$800 versus $24,000 for Bloomberg—95% of the insights at 3% of the cost.
The Frontier Advantage: Taking Action in Overlooked Markets
Frontier market investing represents the final major asset class where information advantages, valuation dislocations, and structural growth trends align to create systematic alpha generation. The cost of ignoring this opportunity is measured not just in foregone returns, but in the permanent portfolio inefficiency of holding overcrowded developed market positions that deliver 7% returns with 18% volatility when frontier allocations can provide 19% returns with 24% volatility – a dramatically superior risk-adjusted profile for sophisticated investors willing to master the operational complexity.
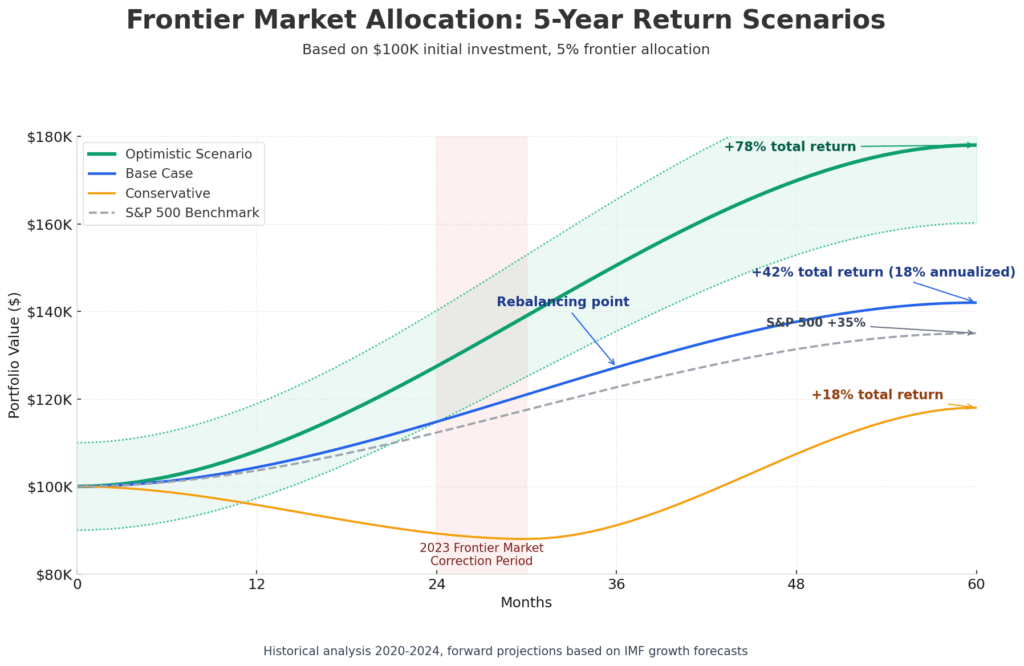
The next 18-24 months present a rare convergence of favorable conditions: Developed market valuations at historical extremes, emerging market correlations broken by geopolitical tensions, frontier market reforms accelerating, and technological infrastructure reaching critical mass for efficient access. Vietnam’s potential MSCI reclassification by 2028, Bangladesh’s demographic dividend entering peak productivity years, and Morocco’s infrastructure renaissance create specific, time-sensitive opportunities that will not persist once these markets attract mainstream institutional capital. The investors who build frontier market expertise now – mastering the custody mechanics, establishing broker relationships, and deploying systematic frameworks – will capture the full cycle of returns that evaporate once frontier markets become tomorrow’s emerging markets.
Your immediate next steps:
- Open accounts at Interactive Brokers and fund with your target frontier allocation within the next 30 days.
- While accounts are being processed, build your Country Opportunity Matrix spreadsheet scoring Vietnam, Morocco, Kenya, and Bangladesh across the five criteria outlined in this guide.
- Deploy your first 40% of capital to your two highest-scoring markets, then systematically add positions monthly over the following quarter.
The window is open, the framework is clear, and the markets are waiting for investors who recognize that the best opportunities exist precisely where institutional capital fears to tread.
For your reference, recently published articles include:
-
-
-
- Best Investing Podcasts for Beginners: Free & Easy to Follow
- The Truth About Consensus Earnings Estimates Accuracy
- Best Financial Literacy Questions to Ask That Will Change Your Life
- Investment Risk Monitoring Example: Best Expert Guide
- Best Long Volatility Strategies: Get The Complete Guide Here
- Best Wine Investment Returns – Get The Pros’ Advice
-
-
………………………………………………..
Important Notice: The information in this article is for general and public information purposes only. It solely reflects Didi Somm’s or his Staff’s opinion, and no responsibility can be assumed for errors or omissions in the service’s contents. For details, please read the Disclaimer at the bottom of the homepage.

