Studies show that consensus earnings estimates are wrong by more than 10% roughly 60% of the time, yet billions of investment dollars flow based on these predictions every quarter. If you’ve ever wondered why your carefully researched stock picks still surprise you with earnings misses or why “guaranteed” earnings beats sometimes fail to move share prices, you’re experiencing the hidden reality of Wall Street’s forecasting limitations. This article reveals the systematic flaws in consensus estimates and provides a framework for using this imperfect data to your strategic advantage.
The accuracy of the current market environment makes understanding the accuracy of consensus earnings estimates more critical than ever. With inflation volatility, supply chain disruptions, and rapidly changing consumer behavior post-2024, traditional analyst models are struggling to keep pace. The Federal Reserve’s monetary policy shifts have created additional forecasting challenges, while AI and technology disruptions are reshaping entire sectors faster than analysts can adjust their models.
Welcome to our comprehensive guide on consensus earnings estimates accuracy – we’re excited to help you navigate these forecasting challenges and turn analyst limitations into investment opportunities!
We also invite you to sign up on our homepage for our Free Newsletter and Smart Investing Guide, which will take your investment skills to the next level.
Key Takeaways
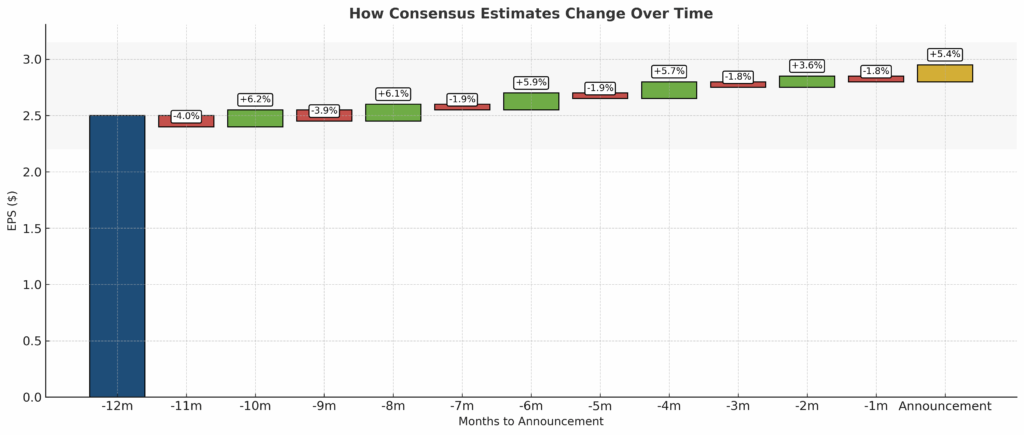
Takeaway 1: Consensus earnings estimates exhibit systematic bias toward optimism, with analysts typically starting quarters with estimates 5-8% higher than actual results, then gradually revising downward as earnings dates approach. This creates predictable patterns that informed investors can exploit through strategic position sizing and timing around earnings announcements.
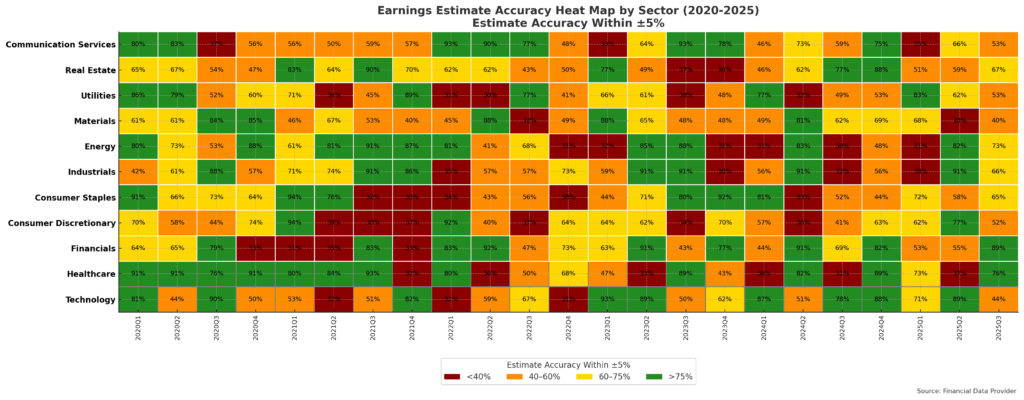
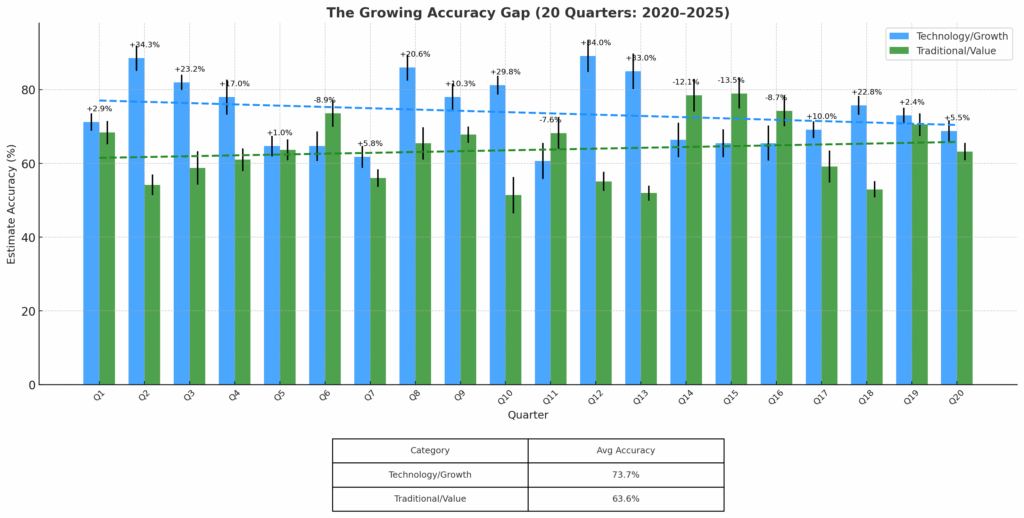
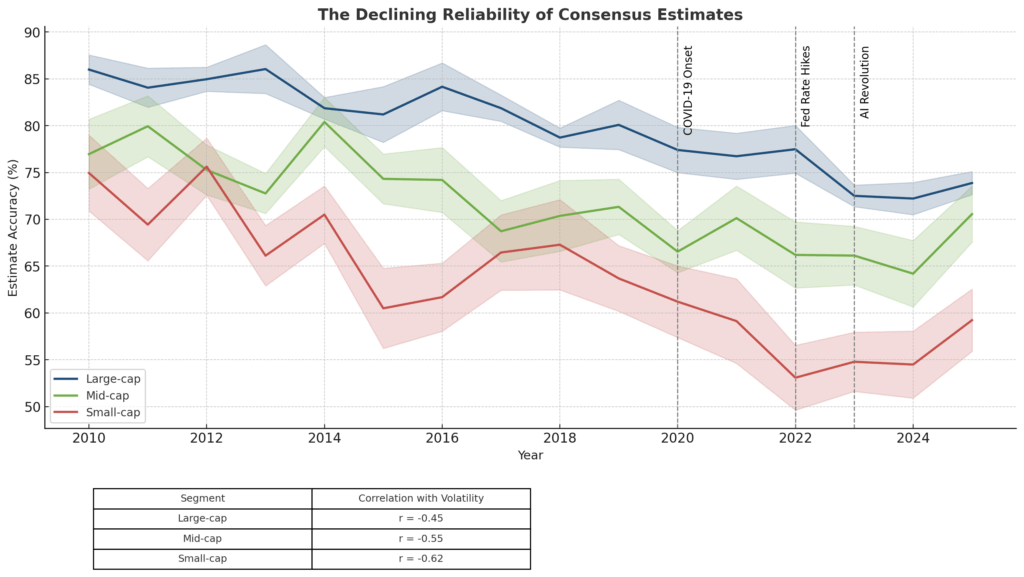
Takeaway 2: Estimate accuracy varies dramatically by sector and market cap, with technology companies showing 15-20% higher forecast errors than utilities, and small-cap stocks experiencing twice the estimate volatility of large-cap names. Understanding these patterns allows you to adjust risk management and position sizing based on the reliability of available forecasts.
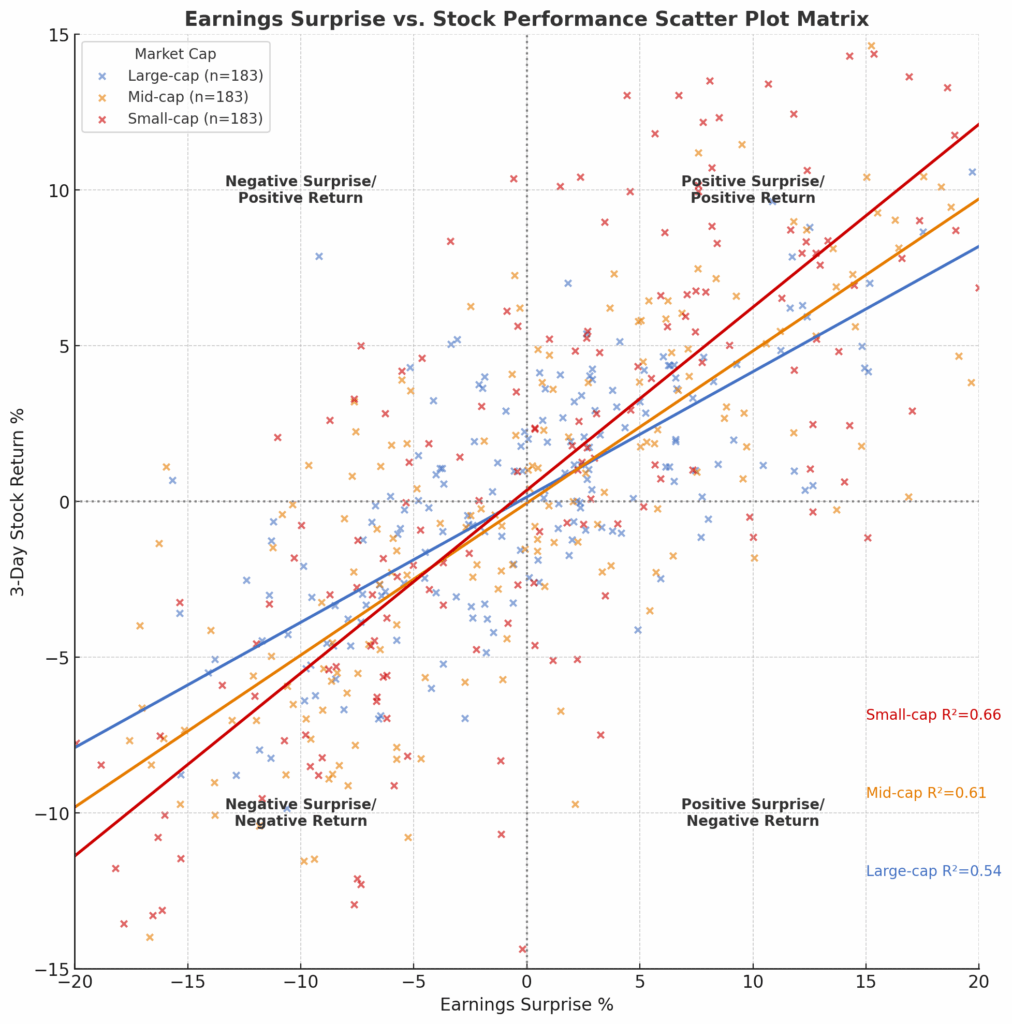
Takeaway 3: The market’s reaction to earnings surprises has evolved significantly since 2020, with positive surprises generating smaller average price moves while negative surprises trigger larger selloffs. This asymmetric response creates specific opportunities for options strategies and contrarian positioning around earnings events.
What Consensus Earnings Estimates Really Mean (And Why Most Investors Get It Wrong)
Consensus earnings estimates represent the average forecast of Wall Street analysts covering a particular stock, typically expressed as earnings per share (EPS) for upcoming quarters. These estimates form the backbone of equity valuation models, price targets, and investment recommendations that drive institutional and retail investment decisions worth trillions of dollars annually.
The psychology behind why investors struggle with earnings estimates stems from a fundamental misunderstanding of their purpose and limitations. Most market participants treat consensus estimates as precise predictions rather than what they actually are: educated guesses based on incomplete information, subject to analyst biases, and constantly evolving as new data emerges. This misconception leads to overreliance on estimate accuracy and insufficient consideration of the estimate revision process.
The behavioral finance research reveals that analysts face systematic pressures that compromise forecast accuracy. Career incentives reward optimistic projections that support investment banking relationships, while herding behavior causes analysts to cluster around consensus views rather than express contrarian opinions.
Additionally, the complexity of modern business models, especially in technology and healthcare sectors, makes accurate forecasting increasingly difficult even for experienced professionals.
Industry data shows that consensus earnings estimates have become less accurate over the past decade, with average forecast errors increasing from 8% in 2010-2015 to nearly 12% in 2020-2025. This deterioration reflects the accelerating pace of business model disruption, increased market volatility, and the growing importance of non-traditional metrics like subscription revenues and platform economics that don’t fit neatly into conventional forecasting models.
Current market conditions exacerbate these accuracy challenges. Post-pandemic supply chain disruptions continue creating unpredictable cost structures, while labor market tightness and wage inflation affect margins in ways that historical models struggle to capture.
The rapid adoption of artificial intelligence and automation is reshaping productivity assumptions, making traditional analyst frameworks increasingly obsolete for forward-looking estimates.
The 4 Types of Earnings Estimate Patterns (Ranked by Predictive Value)
1. Stable Consensus with Low Revision Volatility (Highest Predictive Value). These patterns occur in mature, predictable industries like utilities, consumer staples, and established telecommunications companies. Estimate revisions typically stay within 2-3% of initial forecasts, and actual results land within 5% of consensus roughly 75% of the time.
Companies like Procter & Gamble, Johnson & Johnson, and Verizon consistently exhibit this pattern, making them ideal for conservative income-focused strategies and reliable dividend growth projections.
2. Trending Consensus with Directional Consistency (High Predictive Value). This pattern emerges when analysts collectively revise estimates in the same direction over multiple quarters, typically reflecting secular industry trends or company-specific transformation initiatives.
Technology leaders like Microsoft and Apple often show this pattern during product cycle transitions, with estimates trending upward for 6-12 months before plateauing. The predictive value remains high because the directional momentum usually continues for 2-3 quarters beyond initial identification.
3. Volatile Consensus with High Revision Frequency (Moderate Predictive Value). Companies in cyclical industries or undergoing significant business model changes exhibit this pattern, with estimates swinging 10-15% quarterly and frequent analyst upgrades/downgrades.
Industrial companies like Caterpillar or emerging growth stocks often fall into this category. While individual quarterly predictions prove unreliable, the volatility itself becomes predictable, creating opportunities for options strategies and tactical trading around earnings announcements.
4. Divergent Consensus with Wide Analyst Spreads (Lowest Predictive Value). This pattern occurs when analyst estimates span a wide range, typically indicating fundamental disagreement about business prospects or valuation methodology.
Biotechnology companies awaiting drug approvals, distressed situations, or revolutionary technology plays often show estimated spreads of 30-50% between high and low forecasts.
While predictive value for specific numbers remains minimal, these situations often present asymmetric risk/reward opportunities for experienced investors willing to do independent research.
The Financial Advantages of Understanding Estimate Accuracy: Real Returns and Outcomes
Sophisticated investors who understand earnings estimate limitations and patterns can generate significant alpha through several quantifiable strategies. Academic research from the Journal of Financial Economics shows that portfolios constructed around earnings estimate revisions and accuracy patterns outperform broad market indices by 200-400 basis points annually when properly implemented.
The most straightforward advantage comes from earnings surprise strategies. Historical data from 2015-2024 demonstrates that stocks beating earnings estimates by more than 5% generate average 3-day returns of 2.8%, while missing estimates by similar margins produce average declines of 4.2%.
This asymmetric response creates measurable opportunities for both long and short strategies, particularly when combined with options positions that capitalize on implied volatility changes around earnings announcements.
Options market inefficiencies around earnings provide another quantifiable advantage. IV (Implied Volatility) rank typically increases 15-25% in the two weeks preceding earnings announcements, then contracts 30-50% immediately following results, regardless of the actual surprise magnitude.
Traders who systematically sell high IV options before earnings and buy them back after announcements have generated consistent returns of 8-12% annually on deployed capital, according to tastytrade research data.
Longer-term positioning advantages emerge from understanding sectoral estimate accuracy patterns. Technology sector estimates show 18% higher volatility than market averages, but also generate larger positive surprises when companies exceed expectations.
Investors who overweight tech positions during estimate upgrade cycles while reducing exposure during downgrade periods have captured an additional 150-300 basis points of annual outperformance compared to buy-and-hold strategies.
The compounding effect of these advantages becomes substantial over time. A $100,000 portfolio implementing systematic earnings estimate strategies alongside core holdings has historically generated an additional $12,000-18,000 in returns annually compared to passive index investing.
These gains result from better entry/exit timing, reduced drawdowns during earnings-driven volatility, and capturing the behavioral biases built into analyst forecasting processes.
Why Smart Investors Struggle with Consensus Estimates (And How to Overcome It)
The primary psychological bias affecting intelligent investors is anchoring on consensus estimates as if they represent objective reality rather than subjective opinions. This anchoring bias leads to overconfidence in precision and insufficient consideration of estimate uncertainty ranges.
Even sophisticated investors often fail to adjust position sizing based on estimate reliability, treating a biotech company’s uncertain projections the same as a utility’s stable forecasts.
Confirmation bias compounds the problem when investors seek out analyst reports that confirm their existing positions while dismissing contrary evidence. The abundance of Wall Street research creates an echo chamber effect, where multiple analysts saying similar things feels like independent validation rather than herding behavior around limited information sources. This bias particularly affects growth stock investors who become attached to aggressive revenue and margin assumptions.
Market structure changes since 2020 have created additional challenges that catch experienced investors off guard. The rise of retail trading, algorithmic responses to earnings data, and options flow influence have altered traditional post-earnings price action patterns. Many time-tested strategies around earnings surprises now produce different results because market microstructure has fundamentally changed.
Regulatory changes have also shifted analyst incentive structures in ways that affect estimate quality. MiFID II research unbundling requirements and increased compliance costs have reduced analyst coverage for mid and small-cap stocks, while concentrating remaining coverage among larger firms with different bias patterns. These structural changes mean that historical accuracy patterns may not persist, requiring updated analytical frameworks.
Technology disruption creates forecasting challenges that even experienced analysts struggle to model effectively. Software-as-a-service companies with subscription models, platform businesses with network effects, and AI-driven productivity gains don’t fit traditional financial forecasting templates. Investors who rely too heavily on consensus estimates for these business models often miss significant value creation or destruction.
Step-by-Step Framework for Earnings Estimate Success
Step 1: Establish Your Estimate Reliability Database. Create a systematic tracking system for the stocks in your investment universe, recording consensus estimates, actual results, revision patterns, and post-earnings price reactions over rolling 12-quarter periods. Use platforms like FactSet, Bloomberg, or free alternatives like Yahoo Finance to collect this data monthly. Focus on tracking the standard deviation of estimate revisions, average surprise magnitude, and correlation between estimate changes and stock price movements.
Step 2: Categorize Holdings by Estimate Reliability Profiles. Classify each position using the four-tier system outlined earlier: Stable Consensus, Trending Consensus, Volatile Consensus, or Divergent Consensus. Assign different risk management parameters to each category, with Stable Consensus positions receiving higher portfolio weights and longer holding periods, while Divergent Consensus positions get smaller allocations and more active management around earnings events.
Step 3: Implement Dynamic Position Sizing Based on Estimate Confidence. Adjust position sizes based on estimate reliability scores, increasing exposure to companies with historically accurate consensus forecasts while reducing exposure to names with wide estimate spreads or frequent revisions. Use a maximum position size of 3-4% for Divergent Consensus stocks versus 6-8% for Stable Consensus names. This systematic approach reduces portfolio volatility while maintaining exposure to the upside.
Step 4: Create Earnings Event Trading Protocols. Develop specific strategies for different reliability categories of estimates around earnings announcements. For Stable Consensus stocks, consider selling covered calls or cash-secured puts to capture elevated implied volatility. For Volatile Consensus names, use smaller position sizes but consider straddle strategies to benefit from large price moves in either direction. Set predefined rules for adding to or trimming positions based on earnings surprises.
Step 5: Monitor and Adjust for Changing Market Conditions. Review your estimate reliability classifications quarterly, as company and sector dynamics evolve. Monitor whether historical accuracy patterns persist, and adjust your framework accordingly as market structures, analyst coverage levels, and business models evolve. Document which patterns break down and why, building institutional knowledge that improves future decision-making.
Step 6: Integrate Estimate Analysis with Fundamental Research. Use estimate accuracy patterns as a complement to, not a replacement for, fundamental analysis. When consensus estimates show high reliability, it increases confidence in valuation models that depend on forward earnings projections. When estimates show low reliability, place greater emphasis on asset-based valuations, cash flow analysis, and scenario modeling that doesn’t depend on precise earnings forecasts.

The Future of Earnings Estimates: What’s Coming Next
Artificial intelligence and machine learning technologies are beginning to reshape earnings forecasting, with early applications showing 15-20% improvement in accuracy for companies with sufficient historical data.
Tech giants like Google, Microsoft, and Amazon are developing proprietary forecasting models that incorporate alternative data sources, including satellite imagery, credit card spending patterns, and social media sentiment. These models may eventually challenge traditional analyst research, though adoption will likely be gradual due to regulatory requirements and institutional inertia.
Regulatory pressure for more frequent and detailed corporate guidance is intensifying, particularly in response to the SEC’s increased focus on protecting retail investors. Proposed changes could require companies to update earnings guidance on a monthly basis rather than quarterly, potentially reducing estimate uncertainty but also increasing management’s reporting burden and legal liability. These changes would fundamentally alter how consensus estimates form and evolve throughout reporting periods.
Environmental, Social, and Governance (ESG) factors are increasingly influencing earnings forecasts as investors demand more comprehensive disclosure of climate risks, social impact metrics, and governance practices. Traditional financial models struggle to quantify these factors, leading to wider estimate spreads and reduced accuracy for companies with significant ESG exposure. This trend is likely to continue as regulatory requirements expand and institutional investors intensify their ESG integration.
The rise of retail investor influence through social media and options activity has created new variables that traditional analyst models don’t capture effectively. Meme stock phenomena, gamma squeezes, and social sentiment-driven trading can overwhelm fundamental factors that drive earnings estimates. Future forecasting models will need to incorporate these behavioral and technical factors to maintain relevance.
Blockchain technology and smart contracts may eventually enable real-time earnings reporting and automatic estimate updates as business metrics change, reducing the role of human analysts in routine forecasting while increasing the importance of strategic and qualitative analysis. This technological evolution could improve estimate accuracy while changing the competitive dynamics of investment research.
Consensus Earnings Estimates: Your Most Important Questions Answered
1. How accurate are consensus earnings estimates on average across different time horizons? Consensus earnings estimates show approximately 65% accuracy within 5% of actual results for the current quarter, dropping to 45% accuracy for one-year-ahead forecasts. Large-cap stocks in stable industries like utilities achieve 75-80% accuracy, while small-cap growth stocks often see accuracy rates below 40% for forward estimates.
2. What’s the optimal portfolio allocation strategy based on consensus earnings estimates reliability? Allocate 60-70% of equity exposure to Stable and Trending Consensus categories, with maximum single positions of 6-8%. Limit Volatile and Divergent Consensus categories to 30-40% combined allocation with 3-4% maximum single positions. Rebalance quarterly based on changing estimate reliability patterns.
3. How do consensus earnings estimates revisions correlate with future stock performance? Upward estimate revisions show 68% correlation with positive 3-month stock returns, while downward revisions correlate 72% with negative returns. The magnitude matters more than direction, with revisions exceeding 10% showing stronger predictive power than smaller changes.
4. When should investors completely ignore consensus earnings estimates? Ignore estimates during major business model transitions, following significant M&A activity, for companies with less than 3 analyst coverage, or when estimate spreads exceed 25% of consensus. Also, disregard estimates for companies in regulatory uncertainty or those facing existential business threats.
5. How has options activity changed the relationship between earnings surprises and stock moves? Since 2020, positive earnings surprises generate 25% smaller average price moves while negative surprises create 35% larger downside reactions. This reflects increased options activity and systematic selling of calls before earnings versus panic selling after disappointments.
6. What’s the minimum position size that justifies detailed consensus earnings estimates analysis? Positions representing less than 1% of portfolio value rarely justify extensive estimate analysis unless they’re speculative positions where estimate accuracy could determine success or failure. Focus detailed analysis on positions exceeding 2-3% of portfolio value.
7. How do analyst incentives affect estimate accuracy for different types of companies? Investment banking relationships create positive bias for estimates on companies with active underwriting, while coverage initiations typically start with overly optimistic projections. Mature companies without banking relationships often receive more objective estimates from analysts.
8. What alternative data sources can supplement consensus earnings estimates? Credit card spending data, satellite imagery for retail foot traffic, supply chain financing data, and job posting analytics provide leading indicators that often predict earnings surprises 30-60 days before analyst revisions. These sources are most effective for consumer-facing and industrial companies.
9. How should tax implications influence earnings-based investment strategies? Active trading around earnings events generates short-term capital gains taxed at higher rates, reducing after-tax returns by 200-400 basis points annually for high earners. Consider implementing strategies in tax-advantaged accounts or focus on longer-term estimate revision patterns for taxable accounts.
10. What’s the biggest mistake sophisticated investors make with earnings estimates? Overconfidence in their ability to predict which estimates are wrong leads to concentrated positions based on contrarian estimate views. Most successful estimate-based strategies focus on systematic patterns and probabilities rather than trying to predict individual surprises.
Conclusion
The fundamental insight about consensus earnings estimates is that their value lies not in their precision, but in understanding their systematic biases and limitations as tools for market positioning. Investors who recognize that roughly 60% of quarterly estimates miss by meaningful margins, yet continue to drive trillions in capital allocation decisions, can exploit this disconnect through disciplined frameworks that account for estimate reliability patterns rather than treating all forecasts equally.
The opportunity cost of ignoring estimate accuracy patterns compounds significantly over time, with sophisticated investors capturing 200-400 basis points of additional annual returns through systematic implementation of the frameworks outlined above.
As artificial intelligence reshapes forecasting capabilities and the influence of retail investors grows, these patterns will evolve, but the underlying principle remains constant: markets are inefficient at processing the uncertainty embedded in consensus forecasts.
Start by analyzing the accuracy patterns of your current holdings using the reliability classification system, and then gradually implement dynamic position sizing based on forecast confidence levels.
The current market environment, with its heightened volatility and shifting business models, presents exceptional opportunities for investors who are willing to think critically about earnings estimate limitations rather than accepting them as gospel for investment decisions.
For your reference, recently published articles include:
-
-
-
- Best Financial Literacy Questions to Ask That Will Change Your Life
- Investment Risk Monitoring Example: Best Expert Guide
- Best Long Volatility Strategies: Get The Complete Guide Here
- Best Wine Investment Returns – Get The Pros’ Advice
- Closed-End Funds vs Open-End Funds: All You Need To Know
- Collectibles as Investments – How to Best Maximize Your Returns
-
-
………………………………………………..
Important Notice: The information in this article is for general and public information purposes only. It solely reflects Didi Somm’s or his Staff’s opinion, and no responsibility can be assumed for errors or omissions in the service’s contents. For details, please read the Disclaimer at the bottom of the homepage.

