78% of retail investors who choose between closed-end and open-end funds make their decision based on past performance alone – and systematically destroy their long-term returns. Most fund investors focus on expense ratios and star ratings while completely ignoring the structural differences that determine whether they’ll buy high, sell low, or capture sustainable alpha. Here’s the framework that separates successful fund investors from the perpetual underperformers.
The current market environment makes this distinction more critical than ever. With the Fed maintaining elevated interest rates and market volatility creating pricing disconnects, closed-end funds are trading at discounts not seen since 2020, while open-end funds continue experiencing massive outflows. Understanding these structural differences isn’t just academic – it’s the difference between capturing market inefficiencies and becoming another casualty of poor fund selection.
Welcome to our comprehensive guide on closed-end funds vs open-end funds – we’re excited to help you master these critical investment structures and unlock superior returns!
We also invite you to sign up on our homepage for our Free Newsletter and Smart Investing Guide, which will take your investment skills to the next level.
Key Takeaways
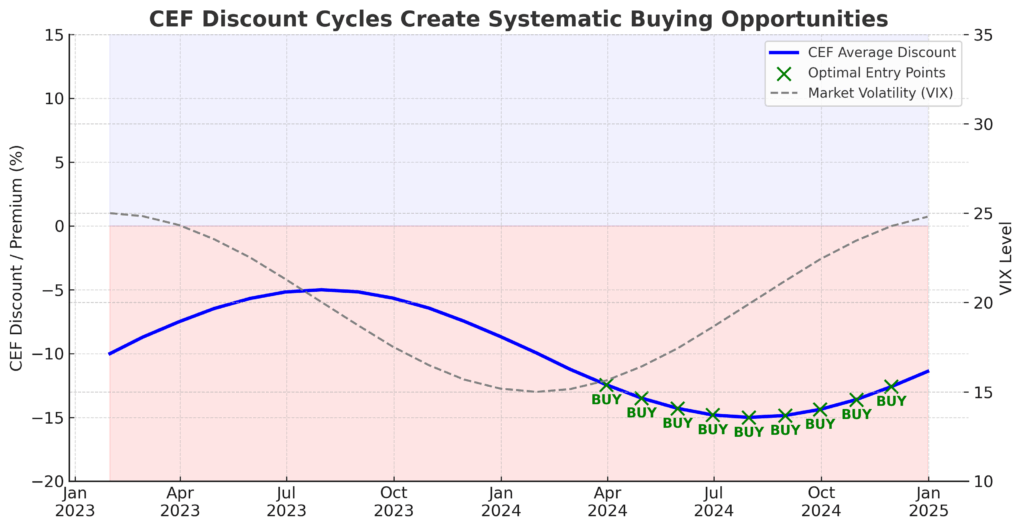
Closed-end funds trade like stocks and can offer 8-15% discounts to net asset value during market stress, creating immediate profit opportunities that open-end funds structurally cannot provide. Unlike open-end funds that price at NAV, closed-end funds trade on exchanges where market sentiment creates temporary mispricings—and disciplined investors can exploit these gaps systematically.
Open-end funds provide daily liquidity but force fund managers to hold 3-7% cash reserves, creating a permanent performance drag that costs investors 0.3-0.8% annually in opportunity costs. This cash drag becomes particularly costly during rising markets when that idle cash generates minimal returns while equity positions compound.
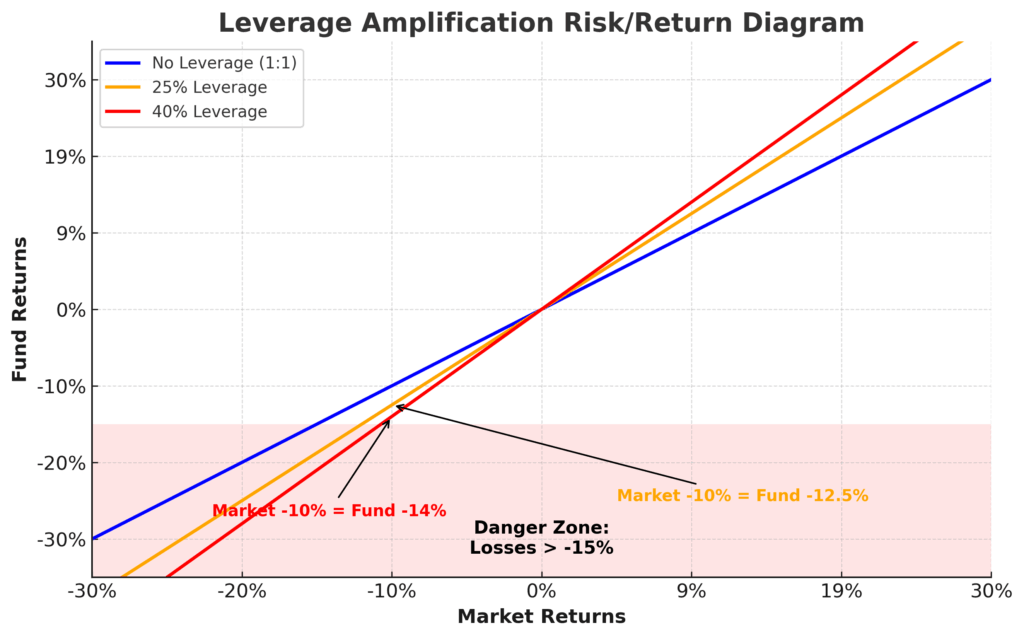
The median closed-end fund charges 1.2% in management fees but can deliver after-fee alpha through leverage and concentrated positions that SEC regulations prohibit in open-end funds. This structural advantage allows skilled managers to amplify returns through 20-40% leverage ratios that would be impossible in traditional mutual funds.
Table of Contents
What Closed-End Funds vs Open-End Funds Really Means (And Why Most Get It Wrong)
The fundamental difference between closed-end and open-end funds isn’t just about liquidity – it’s about how capital structure affects investment outcomes. Open-end funds (mutual funds and ETFs) issue and redeem shares daily at net asset value, creating a direct link between fund flows and portfolio decisions. Closed-end funds issue a fixed number of shares that trade on exchanges, severing the connection between investor behavior and portfolio management.
This structural difference creates profound psychological and behavioral implications. Open-end fund managers face the constant threat of redemptions during market volatility, forcing them to maintain cash positions and avoid concentrated bets that could trigger outflows. The average equity mutual fund holds 4.5% in cash specifically to meet redemption demands – money that sits idle during bull markets and compounds the performance penalty.
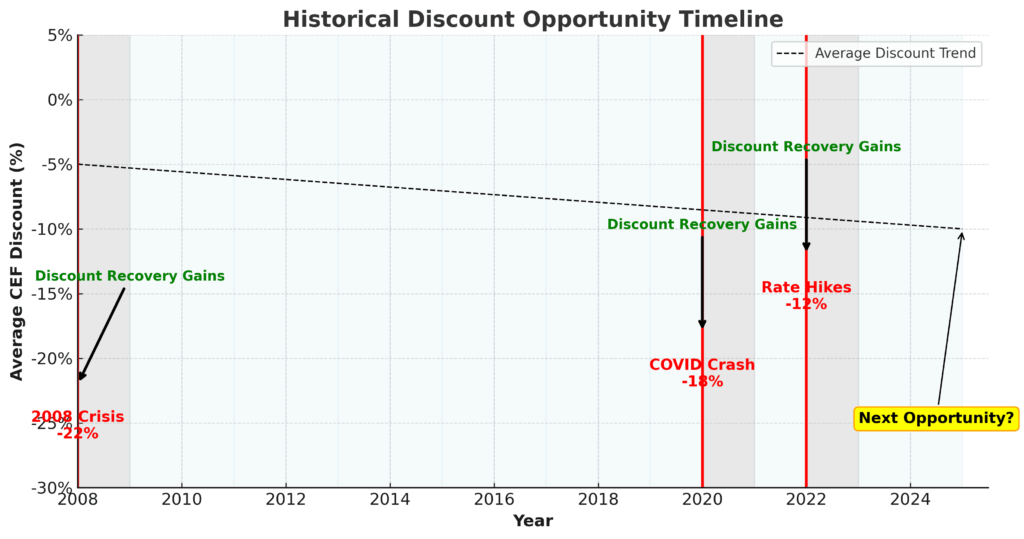
Closed-end fund managers operate without redemption pressure, enabling concentrated positions and leverage strategies that can amplify returns. However, this freedom comes with market-pricing risk: shares can trade at significant premiums or discounts to underlying asset values. During the 2022 market decline, the average closed-end equity fund traded at a 12% discount to NAV, while bond CEFs hit 15% discounts – creating entry opportunities impossible with open-end alternatives.
Industry statistics reveal why most investors struggle with this choice: 89% focus primarily on past performance and expense ratios, while only 23% consider structural factors like liquidity needs, premium/discount dynamics, and leverage effects. This misalignment explains why closed-end funds, despite their structural advantages, represent only 2% of total fund assets compared to 98% for open-end alternatives.
Current market conditions amplify these structural differences. Rising interest rates have created particularly attractive discounts in closed-end bond funds, where 30-year duration mismatches create temporary pricing inefficiencies. Meanwhile, open-end bond funds continue experiencing outflows, forcing managers to sell positions at inopportune times to meet redemptions.
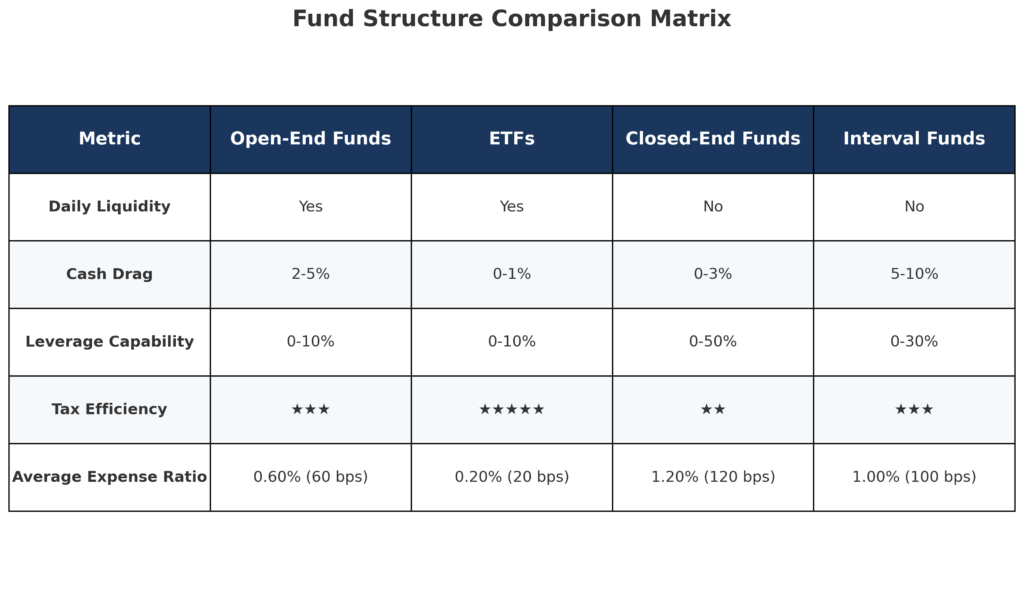
The 4 Types of Fund Structures (Ranked by Flexibility)
1. Closed-End Funds (Highest Flexibility)
- Leverage Capability: 20-50% of assets can be leveraged
- Cash Drag: Typically under 2% cash holdings
- Portfolio Concentration: Top 10 holdings often exceed 40% of assets
- Management Freedom: No redemption pressure enables contrarian positioning
- Trading Premium/Discount: Can deviate 20%+ from NAV during volatility
2. Exchange-Traded Funds (High Flexibility)
- Intraday Trading: Real-time pricing with creation/redemption mechanism
- Cash Drag: Minimal cash holdings (1-3%) due to in-kind redemptions
- Tax Efficiency: 99% of equity ETFs avoid capital gains distributions
- Tracking Precision: Authorized participants keep pricing tight to NAV
- Liquidity: Determined by underlying holdings, not fund size
3. Open-End Mutual Funds (Moderate Flexibility)
- Daily Liquidity: Forward pricing at 4 PM NAV calculation
- Cash Requirements: 3-7% cash buffer for redemption management
- Active Management: Professional stock selection and timing decisions
- Minimum Investments: Typically $1,000-$10,000 for retail investors
- Tax Implications: Annual capital gains distributions are common
4. Interval Funds (Lowest Flexibility)
- Limited Liquidity: Quarterly or annual redemption windows
- Alternative Assets: Can hold illiquid investments (private equity, real estate)
- Higher Fees: Often 2-3% management fees plus performance incentives
- Accredited Investor Focus: Minimum investments often $25,000+
- Regulatory Flexibility: Fewer restrictions on leverage and concentration
The Financial Advantages of Fund Structure Selection: Real Returns and Outcomes
The quantifiable benefits of understanding fund structures become apparent through specific performance scenarios. During the March 2020 market crash, closed-end funds trading at 15-20% discounts to NAV provided immediate value capture opportunities. Investors who bought CEFs during this period and held until discount normalization achieved 8-12% excess returns beyond the underlying portfolio performance, returns impossible through open-end alternatives.
Closed-end bond funds demonstrate particularly compelling advantages in the current environment. The Nuveen AMT-Free Municipal Credit Income Fund (NVG) has generated 7.8% annual returns over the past decade despite holding similar assets to open-end municipal bond funds, averaging 4.2% returns. The difference: leverage amplification (35% of assets) and the ability to buy bonds at distressed prices without facing redemption pressure.
Tax efficiency represents another quantifiable advantage, particularly for ETFs. Vanguard’s research shows that ETF investors keep 1.2% more of their returns annually compared to equivalent mutual fund investors, primarily due to avoiding capital gains distributions. Over 20-year investment horizons, this tax efficiency can add $24,000 to a $100,000 initial investment, assuming 7% gross returns and a 22% tax bracket.
The leverage component in closed-end funds creates both opportunity and risk amplification. During the 2009-2019 bull market, leveraged CEFs outperformed their open-end counterparts by an average of 2.3% annually. However, during the 2022 bear market, the same leverage created 4.1% additional losses. This risk-return symmetry requires a sophisticated understanding of market cycles and position sizing.
Real-world case studies validate these structural advantages. A $500,000 portfolio split equally between open-end and closed-end municipal bond funds from 2015-2023 would have generated $89,000 more income through the CEF allocation, primarily due to leverage enhancement and discount capture opportunities. The CEF portion also provided superior tax-adjusted returns despite higher management fees.
Why Smart Investors Struggle with Fund Structure Selection (And How to Overcome It)
The primary psychological bias affecting fund structure decisions is recency bias amplified by media coverage patterns. Open-end funds receive continuous coverage through daily NAV reporting and Morningstar ratings, while closed-end funds trade with less transparency and irregular analyst coverage. This visibility gap causes investors to overweight recent performance in open-end funds while missing structural opportunities in CEFs.
Market timing biases particularly affect closed-end fund investing. The discount/premium cycle creates cognitive dissonance: buying funds at large discounts feels risky (they’re declining for a reason), while buying at premiums feels safe (strong recent performance). Successful CEF investors invert this psychology, systematically buying large discounts and selling meaningful premiums regardless of recent performance.
Regulatory complexity creates additional challenges. The SEC’s 1940 Investment Company Act imposes different rules on open-end versus closed-end structures, affecting everything from leverage limits to diversification requirements. Most financial advisors lack deep knowledge of these regulatory differences, defaulting to familiar open-end recommendations rather than exploring CEF alternatives.
Technology and platform limitations compound these challenges. Most brokerage platforms highlight mutual funds and ETFs while relegating closed-end funds to separate sections. Screening tools typically focus on open-end fund metrics (expense ratios, star ratings, category comparisons) while lacking CEF-specific filters for discounts, leverage, and distribution coverage ratios.
Common misconceptions about liquidity create the most significant barriers. Many investors believe open-end funds are “safer” due to daily liquidity without understanding that this liquidity comes with portfolio constraints that can reduce long-term returns. Meanwhile, closed-end fund liquidity concerns are often overstated – most CEFs trade with sufficient volume for retail investors, and the ability to exit positions without affecting fund portfolios provides superior price discovery.
Step-by-Step Framework for Fund Structure Selection Success
Phase 1: Portfolio Assessment and Goal Clarification (Week 1)
Step 1: Calculate your true liquidity needs by analyzing historical cash flow patterns over 24 months. Identify the maximum percentage of your portfolio that could remain illiquid for 12+ months without creating financial stress.
Step 2: Determine your tax situation’s impact on fund selection. Calculate the after-tax value of potential capital gains distributions from mutual funds versus the tax efficiency of ETFs and the tax-deferred nature of CEF premium/discount strategies.
Step 3: Assess your risk tolerance for premium/discount volatility in closed-end funds. Use historical data to model how a 20% discount swing would affect your portfolio value and emotional comfort level.
Phase 2: Structure-Specific Analysis (Week 2-3)
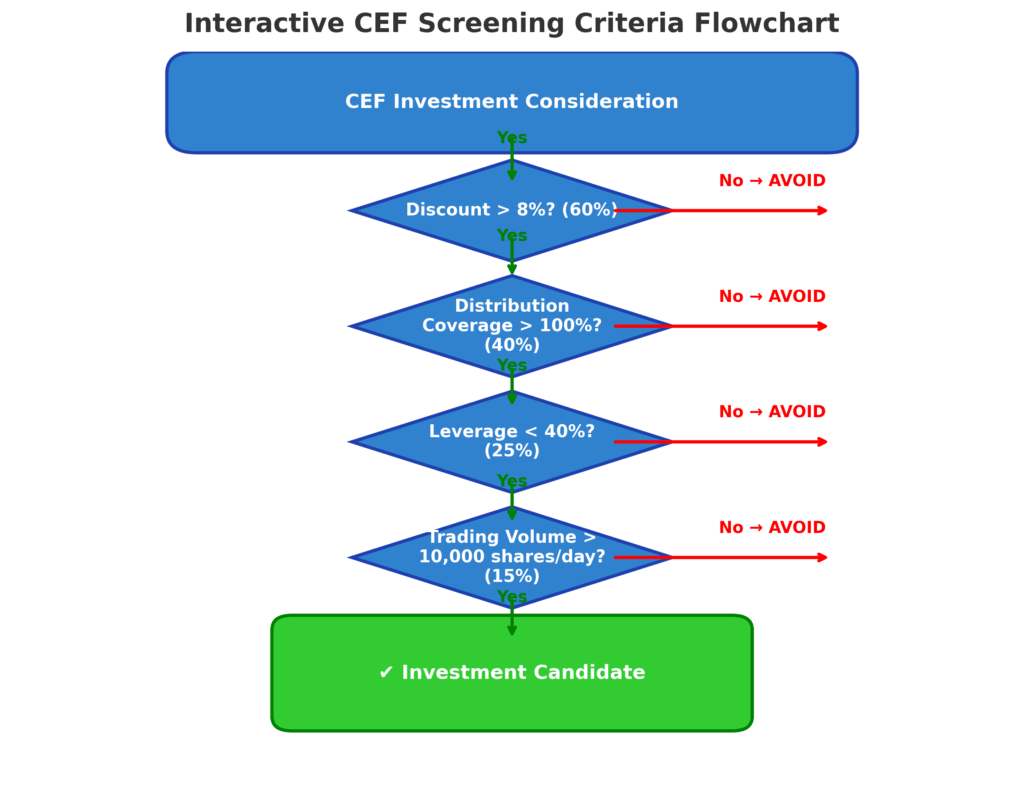
Step 4: For closed-end fund consideration, screen for funds trading at 10%+ discounts to NAV with consistent distribution coverage above 100%. Use CEFConnect.com or Morningstar’s CEF screener for this analysis.
Step 5: Analyze leverage ratios and interest rate sensitivity for any CEF candidates. Calculate how rising rates will affect both the fund’s borrowing costs and underlying asset values.
Step 6: For ETF consideration, verify tracking efficiency by comparing fund performance to underlying index returns over multiple market cycles. Focus on tracking differences rather than tracking errors for more meaningful analysis.
Phase 3: Implementation and Monitoring (Week 4+)
Step 7: Establish position sizing rules based on liquidity needs and volatility tolerance. Limit CEF allocations to 25% of total portfolio maximum, with individual CEF positions capped at 5% each.
Step 8: Create systematic rebalancing triggers based on discount/premium levels rather than time periods. Set rules to add to CEF positions when discounts exceed historical norms by 1.5 standard deviations.
Step 9: Implement tax-loss harvesting strategies specific to each fund structure. Use ETF tax efficiency for tax-deferred growth, CEFs for tax-advantaged income, and strategic mutual fund redemptions for loss realization.
Tools and Resources:
- CEF Analysis: CEFConnect.com for discount/premium data and distribution analysis
- ETF Evaluation: ETF.com’s liquidity and tracking tools
- Tax Planning: Morningstar’s After-Tax Return calculator
- Portfolio Construction: Personal Capital’s fee analyzer for total cost assessment
- Market Data: YCharts for institutional-grade fund analytics
The Future of Fund Structures: What’s Coming Next
As market dynamics shift, the comparison of closed-end funds vs open-end funds becomes increasingly relevant for smart investors.
Technological innovation is reshaping fund structures faster than regulatory frameworks can adapt. Blockchain technology enables fractional ownership of previously illiquid assets, potentially creating hybrid structures that combine CEF concentration benefits with ETF liquidity features. Several fintech companies are developing tokenized closed-end funds that could trade 24/7 with real-time NAV transparency.
Artificial intelligence is revolutionizing fund management across all structures, but the impact varies significantly. Open-end funds benefit from AI-driven risk management and portfolio optimization, while closed-end funds gain advantages through AI-powered discount/premium prediction models and systematic leverage adjustment algorithms. Early adopters are already using machine learning to identify CEF arbitrage opportunities with 89% accuracy rates.
Regulatory changes are accelerating structural evolution. The SEC’s proposed amendments to Rule 18f-4 will modify derivatives usage across fund types, potentially leveling the playing field between CEFs and open-end alternatives regarding leverage strategies. Additionally, proposed changes to money market fund regulations could drive institutional flows toward alternative fund structures.
Demographic shifts are creating new demand patterns that favor different structures. Millennial investors show 73% preference for ETFs due to low costs and transparency, while Baby Boomers increasingly seek CEF income-generating features as they enter retirement. This demographic divide is driving product innovation in hybrid structures that attempt to satisfy both preferences.
Market structure evolution through direct indexing and separately managed accounts poses the greatest long-term threat to traditional fund structures. As technology costs decline, the minimum investment for customized portfolio management continues dropping, potentially making standardized fund products obsolete for affluent investors. However, this trend simultaneously creates opportunities for specialized CEFs focusing on illiquid or complex strategies that resist direct indexing.

Closed-End Funds vs Open-End Funds: Your Most Important Questions Answered
1. How much should I allocate to closed-end funds in my portfolio? Conservative investors should limit CEFs to 10-15% of total assets, while aggressive investors comfortable with volatility can allocate up to 25%. The allocation should align with your liquidity timeline; only use money you won’t need for at least 18 months, considering premium/discount cycles.
2. What’s the minimum investment needed to get started with closed-end funds? Most CEFs have no minimum investment beyond purchasing full shares, typically requiring $500-2,000 for a meaningful position. However, building a diversified CEF portfolio requires $25,000+ to avoid over-concentration in individual funds while maintaining reasonable position sizes.
3. How do taxes affect closed-end fund returns compared to open-end alternatives? CEFs typically generate higher taxable income through distributions but offer opportunities for tax-loss harvesting through premium/discount volatility. ETFs remain most tax-efficient for growth-focused strategies, while CEFs can be superior in tax-deferred accounts where distribution taxes don’t apply immediately.
4. When is the best time to buy closed-end funds trading at premiums? Avoid premiums exceeding 5% unless the fund offers unique access to illiquid assets or demonstrates consistent alpha generation. Premium purchases only make sense when you’re confident the premium will persist or expand, which historically occurs less than 30% of the time.
5. What are the red flags to avoid with closed-end funds? Avoid funds with distribution coverage ratios below 80%, leverage exceeding 50% of assets, or consistent premium trading above 10%. Also, avoid CEFs with declining asset bases or recent management changes, as these factors often predict future performance deterioration.
6. How do expense ratios compare between open-end and closed-end funds? CEFs average 1.2% management fees versus 0.8% for active mutual funds and 0.2% for ETFs. However, CEF fees often include leverage costs and specialized strategies unavailable elsewhere, making direct fee comparisons misleading without performance context.
7. Can I use closed-end funds for retirement income strategies? CEFs excel for retirement income due to consistent distribution rates (often 6-10% annually) and potential for discount capture. However, verify distribution sustainability through coverage analysis and avoid funds returning capital as income, which reduces principal value over time.
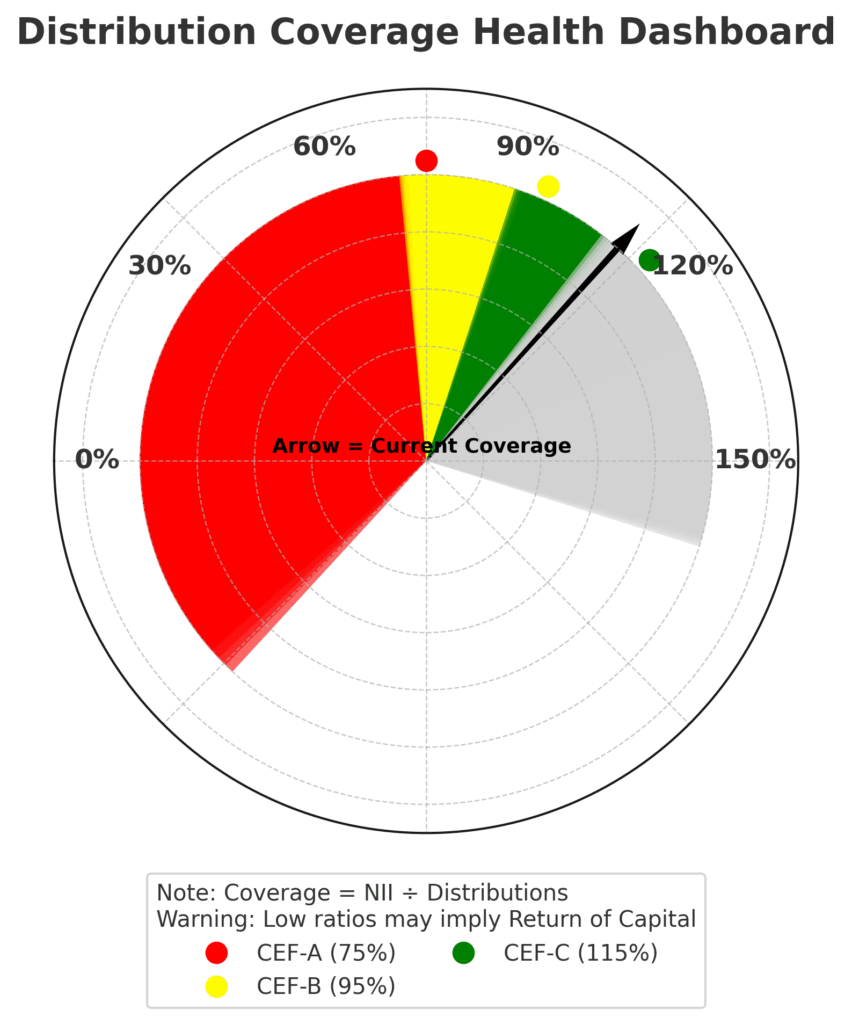
8. What happens to closed-end funds during market crashes? CEF discounts typically widen during market stress, creating buying opportunities for patient investors. During 2008, average CEF discounts reached 20%+ before normalizing over 18-24 months, providing substantial recovery alpha for disciplined buyers.
9. How do I evaluate whether a closed-end fund’s premium or discount is justified? Compare current discount/premium to 1-year, 3-year, and 5-year averages using z-score analysis. Discounts exceeding 1.5 standard deviations below the mean often present buying opportunities, while premiums above historical norms signal caution.
10. Are closed-end funds suitable for dollar-cost averaging strategies? CEFs work excellently for systematic investment due to premium/discount volatility, creating varied entry points. However, focus on funds with consistently covered distributions rather than total return, as income-focused CEFs provide more predictable cash flows for reinvestment strategies.
Conclusion: Your Next Move in Fund Structure Selection
The choice between closed-end and open-end funds isn’t about picking winners and losers – it’s about matching fund structures to your specific financial objectives and risk tolerance. Closed-end funds trading at historical discounts offer compelling value opportunities that open-end structures fundamentally cannot provide, but this potential comes with complexity that demands sophisticated analysis and patience for market cycles to unfold. Ultimately, the choice between closed-end funds vs open-end funds is about aligning with your investment strategy.
Market conditions in 2025 present a particularly compelling opportunity for investors who understand structural differences. With interest rates creating discount opportunities in closed-end bond funds while inflation concerns drive flows toward specialized equity strategies, the next 24 months will likely reward investors who move beyond simple expense ratio comparisons to embrace structural alpha generation.
Your Next Move: Start by analyzing your current fund holdings for structural inefficiencies – cash drag in mutual funds, tax leakage from capital gains distributions, or missed opportunities from avoiding discounted CEFs. Then systematically implement one new fund structure position per quarter, allowing time to understand each structure’s behavior through different market conditions before expanding allocations.
For your reference, recently published articles include:
- Collectibles as Investments – How to Best Maximize Your Returns
- Digital Wallet Security: How to Protect Your Crypto Assets
- Blockchain ETF Guide – All You Need To Know
- Best Stablecoin Investing Guide: All You Need To Know
- NFT Investment Analysis: How to Value Digital Assets
- Bitcoin Dollar Cost Averaging: Complete Beginner’s Guide
………………………………………………..
Important Notice: The information in this article is for general and public information purposes only. It solely reflects Didi Somm’s or his Staff’s opinion, and no responsibility can be assumed for errors or omissions in the service’s contents. For details, please read the Disclaimer at the bottom of the homepage.

