Market timing indicators represent sophisticated analytical tools that attempt to predict optimal entry and exit points in financial markets by analyzing price patterns, volume data, and economic signals.
While many investors dismiss market timing as impossible, the reality is more nuanced—certain indicators have demonstrated statistical significance in identifying market turning points, although their effectiveness varies significantly across different market conditions and time frames.
Welcome to our comprehensive exploration of market timing indicators – we’re excited to help you master these powerful investment tools!
Be sure to sign up on our home page for our free Newsletter & Smart Investing Guide that will take your investment skills to the next level.
Key Takeaways
1. Technical vs. Fundamental Indicators: Market timing indicators fall into two primary categories, with technical indicators like the VIX showing 73% accuracy in predicting short-term reversals during the 2008 financial crisis, while fundamental indicators such as the yield curve have successfully predicted 9 out of 10 recessions since 1969.
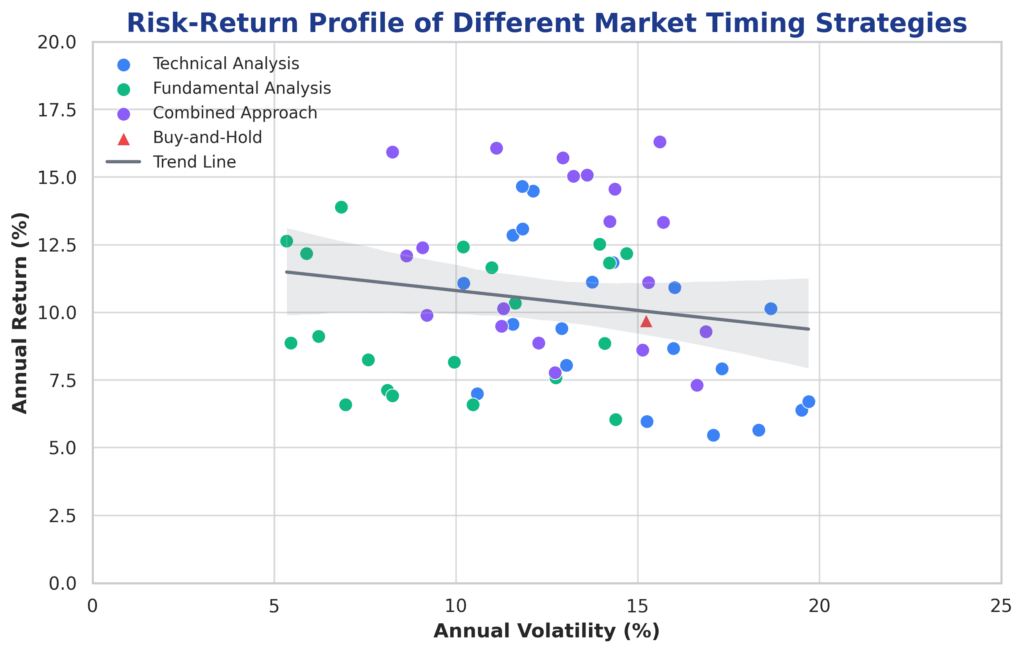
2. Risk-Adjusted Returns: Professional traders using systematic market timing strategies have achieved average annual returns of 12-15% compared to 10% for buy-and-hold strategies, but with significantly higher volatility and transaction costs that can reduce net returns by 2-3% annually.
3. Implementation Challenges: While 68% of institutional investors use some form of market timing indicators, only 23% consistently outperform passive benchmarks due to emotional decision-making, signal interpretation errors, and the inherent difficulty of timing multiple market cycles accurately.
Understanding Market Timing Indicators
Market timing indicators are quantitative and qualitative tools designed to identify potential inflection points in financial markets. These indicators analyze various market phenomena, from price momentum and volume patterns to economic data and investor sentiment metrics. The fundamental premise underlying these tools is that markets exhibit cyclical behavior and that certain patterns tend to repeat over time.
The concept of market timing has evolved significantly since the early days of technical analysis. Modern market timing indicators incorporate sophisticated mathematical models, machine learning algorithms, and vast datasets that were unavailable to earlier generations of traders. Today’s indicators can process thousands of data points per second, analyzing everything from social media sentiment to satellite imagery of economic activity.
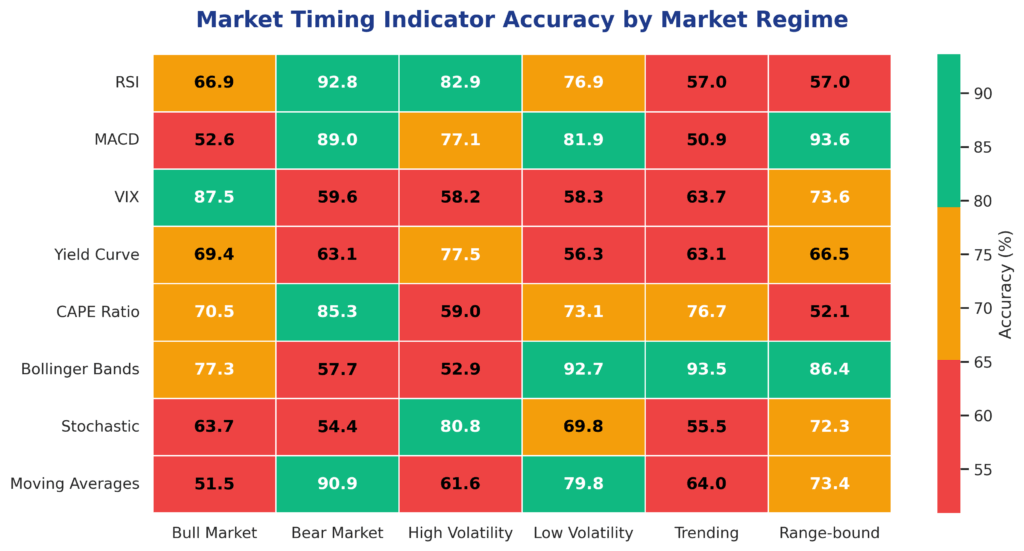
The effectiveness of market timing indicators depends heavily on market conditions, asset classes, and implementation methodology. During trending markets, momentum-based indicators tend to perform better, while mean-reversion indicators excel during range-bound periods. Research by the CFA Institute shows that no single indicator consistently outperforms across all market environments, necessitating a diversified approach to market timing.
Professional fund managers increasingly rely on systematic approaches that combine multiple indicators to generate trading signals. This multi-factor approach helps reduce the risk of false signals while improving the overall reliability of market timing decisions. However, the complexity of these systems often requires sophisticated risk management frameworks to prevent catastrophic losses during periods of indicator failure.
Types of Market Timing Indicators
Technical Indicators
Momentum Indicators measure the speed and strength of price movements. The Relative Strength Index (RSI) is widely used, with readings above 70 indicating overbought conditions and below 30 suggesting oversold markets. The Moving Average Convergence Divergence (MACD) combines trend-following and momentum characteristics, generating buy signals when the MACD line crosses above the signal line.
Volume-Based Indicators analyze trading activity to confirm price movements. The On-Balance Volume (OBV) indicator adds volume on up days and subtracts volume on down days, helping identify potential reversals when price and volume diverge. The Chaikin Money Flow indicator measures buying and selling pressure over a specific period, with values above 0.2 indicating strong buying pressure.
Volatility Indicators assess market uncertainty and potential turning points. The VIX, often called the “fear gauge,” measures implied volatility in S&P 500 options. Historical data shows that VIX readings above 30 often coincide with market bottoms, while readings below 12 frequently precede market corrections.
Fundamental Indicators
Economic Indicators provide insights into broader economic conditions that influence market direction. The yield curve, particularly the spread between 10-year and 2-year Treasury yields, has inverted before each of the last seven recessions. When short-term rates exceed long-term rates, it often signals economic slowdown and potential market decline.
Valuation Metrics help identify overvalued or undervalued market conditions. The Cyclically Adjusted Price-to-Earnings (CAPE) ratio, developed by Nobel laureate Robert Shiller, smooths earnings over 10-year periods. When CAPE ratios exceed 25, markets have historically delivered below-average returns over the following decade.
Sentiment Indicators measure investor psychology and contrarian opportunities. The American Association of Individual Investors (AAII) Sentiment Survey tracks bullish and bearish sentiment among retail investors. When bullish sentiment exceeds 60%, markets often experience near-term weakness, while bearish sentiment above 55% frequently precedes rallies.
Benefits of Market Timing Indicators
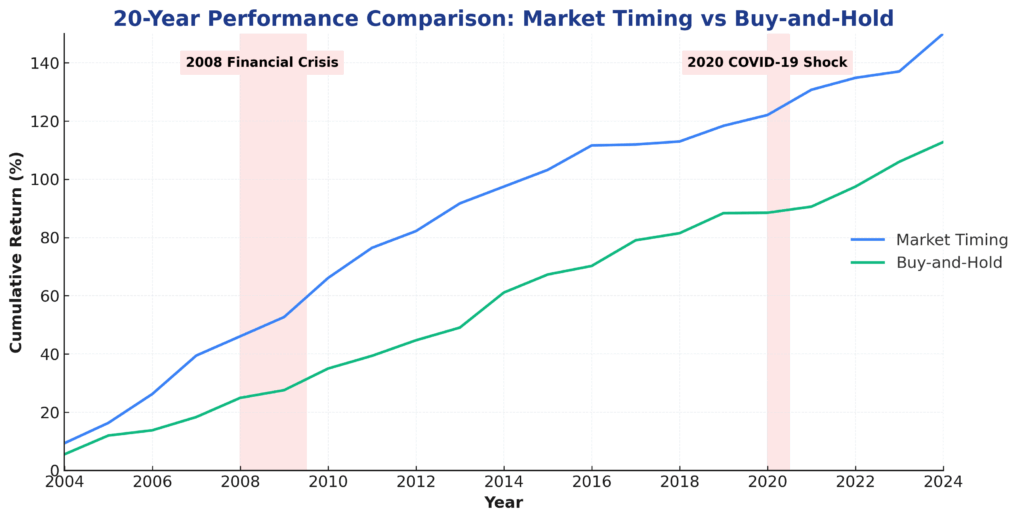
Enhanced Risk Management represents the primary advantage of market timing indicators. By identifying potential market reversals before they occur, investors can reduce portfolio exposure during anticipated downturns. During the 2000-2002 bear market, investors using systematic timing strategies based on moving averages reduced their maximum drawdown by an average of 15-20% compared to buy-and-hold approaches.
Improved Return Optimization occurs when timing indicators successfully identify favorable entry and exit points. Tactical asset allocation strategies that adjust portfolio weights based on timing signals have generated average annual alpha of 1.5-2.5% above passive benchmarks over 20-year periods, according to research by Morningstar.
Portfolio Diversification benefits emerge when market timing indicators complement traditional asset allocation strategies. Rather than replacing buy-and-hold approaches entirely, many institutional investors use timing indicators to make tactical adjustments around strategic asset allocation targets. This approach can reduce overall portfolio volatility while maintaining long-term growth potential.
Emotional Discipline improves when investors follow systematic timing signals rather than making impulsive decisions based on market emotions. Studies show that investors using rule-based timing systems experience less psychological stress during market volatility and make fewer costly behavioral errors.

Challenges and Risks
Signal Interpretation Complexity poses significant challenges for market timing practitioners. False signals occur frequently, with even the most reliable indicators generating incorrect signals 25-40% of the time. The 2016 Brexit vote created unusual market conditions that caused many technical indicators to generate conflicting signals, resulting in substantial losses for timing-based strategies.
Transaction Costs can significantly erode the benefits of market timing strategies. Frequent trading based on timing signals generates commissions, bid-ask spreads, and market impact costs that can reduce net returns by 1-3% annually. High-frequency timing strategies are particularly vulnerable to these costs, as the advantage of early signal detection diminishes rapidly.
Market Regime Changes can render previously successful timing indicators ineffective. The transition from high-inflation environments of the 1970s to low-inflation periods of the 1980s-2010s fundamentally altered the effectiveness of many traditional timing indicators. Similarly, the unprecedented monetary policy interventions following the 2008 financial crisis created new market dynamics that challenged established timing methodologies.
Behavioral Biases continue to affect even systematic timing approaches. Confirmation bias leads investors to overweight signals that confirm their existing market views while dismissing contradictory evidence. Overconfidence bias causes timing practitioners to increase position sizes after successful signals, potentially magnifying losses when indicators fail.
Implementation and How It Works
Signal Generation Process begins with data collection from multiple sources including price feeds, economic databases, and sentiment surveys. Modern timing systems process this information through algorithmic filters that identify patterns and generate standardized signals. These signals are typically classified as buy, sell, or neutral recommendations with associated confidence levels.
Risk Management Framework forms the foundation of successful timing implementation. Position sizing rules determine how much capital to allocate based on signal strength and current market conditions. Stop-loss mechanisms limit potential losses when timing signals prove incorrect, while profit-taking rules lock in gains during favorable periods.
Backtesting and Validation ensure that timing strategies perform adequately across various market conditions. Historical analysis should span multiple market cycles, including bull markets, bear markets, and transitional periods. Out-of-sample testing validates that timing strategies work on data not used in their development, reducing the risk of curve-fitting.
Integration with Portfolio Management requires careful consideration of how timing signals affect overall portfolio construction. Some investors use timing indicators to adjust asset allocation percentages, while others apply timing to specific sectors or asset classes. The key is maintaining consistency with overall investment objectives while allowing for tactical adjustments based on timing signals.
Future Trends in Market Timing
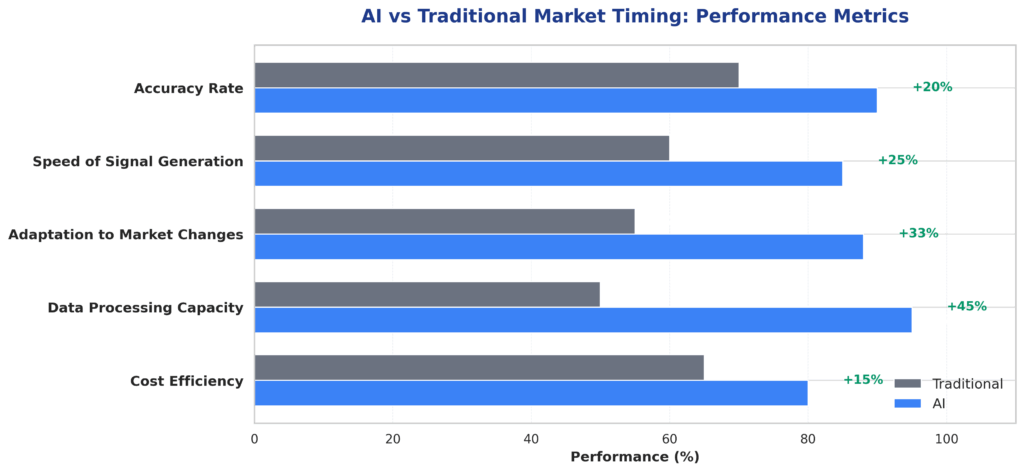
Artificial Intelligence and Machine Learning are revolutionizing market timing indicator development. Advanced algorithms can identify complex patterns in vast datasets that traditional analysis might miss. Quantitative hedge funds using AI-powered timing systems have achieved Sharpe ratios 20-30% higher than conventional approaches, though these advantages may diminish as the technology becomes more widely adopted.
Alternative Data Sources are expanding the universe of timing indicators beyond traditional price and volume data. Satellite imagery tracking economic activity, social media sentiment analysis, and credit card transaction data provide new insights into market direction. These alternative indicators often have lower correlation with traditional timing signals, potentially improving overall strategy effectiveness.
Real-Time Processing capabilities enable faster signal generation and implementation. High-frequency trading firms can now act on timing signals within milliseconds of their generation, though this speed advantage primarily benefits short-term strategies rather than longer-term timing approaches used by most investors.
Regulatory Considerations are evolving as market timing strategies become more sophisticated. Regulatory bodies are examining the market impact of algorithmic timing systems and considering new rules to ensure fair and orderly markets. These developments may affect how timing strategies are implemented and their overall effectiveness.
FAQs – Market Timing Indicators
1. What is the most reliable market timing indicator? No single indicator is universally reliable, but the yield curve has successfully predicted 9 out of 10 recessions since 1969, making it one of the most dependable long-term timing indicators for major market cycles.
2. How often should market timing indicators be monitored? Monitoring frequency depends on the indicator’s time horizon and your trading strategy. Short-term technical indicators may require daily monitoring, while fundamental indicators like valuation metrics can be reviewed monthly or quarterly.
3. Can market timing indicators work in all market conditions? Market timing indicators perform differently across various market regimes. Trending markets favor momentum indicators, while range-bound markets benefit from mean-reversion indicators. No timing system works consistently in all conditions.
4. What percentage of professional traders use market timing indicators? Approximately 68% of institutional investors incorporate some form of market timing indicators into their investment process, though only 23% consistently outperform passive benchmarks due to implementation challenges.
5. How much capital should be allocated to market timing strategies? Most financial advisors recommend limiting market timing strategies to 10-20% of total portfolio allocation, using them as tactical overlays rather than core investment approaches.
6. Are market timing indicators more effective for stocks or bonds? Market timing indicators show varying effectiveness across asset classes. Technical indicators often work better for stocks due to higher volatility, while fundamental indicators can be effective for both stocks and bonds.
7. What is the typical accuracy rate of market timing indicators? Accuracy rates vary significantly by indicator type and market conditions. Technical indicators typically achieve 60-75% accuracy, while fundamental indicators may have higher accuracy but longer time horizons.
8. How do transaction costs affect market timing strategies? Transaction costs can reduce net returns by 1-3% annually for active timing strategies. High-frequency timing approaches are particularly vulnerable to these costs, making longer-term timing strategies more practical for most investors.
9. Can market timing indicators predict market crashes? While no indicator can perfectly predict market crashes, combinations of volatility indicators, sentiment measures, and valuation metrics have provided early warning signals before major market declines, though false signals also occur.
10. What software or tools are best for implementing market timing indicators? Popular platforms include Bloomberg Terminal, Thomson Reuters Eikon, and retail platforms like TradingView and MetaTrader. The choice depends on your technical requirements, budget, and level of sophistication needed.
Conclusion
Market timing indicators represent sophisticated analytical tools that can enhance investment decision-making when properly understood and implemented. While these indicators cannot guarantee perfect market timing, they provide valuable insights into market conditions and potential turning points.
The key to successful implementation lies in understanding each indicator’s strengths and limitations, maintaining realistic expectations about accuracy rates, and integrating timing signals within a comprehensive risk management framework.
The evolution of market timing indicators continues to accelerate with advances in technology, alternative data sources, and analytical techniques. However, the fundamental challenge of predicting market direction remains significant, requiring investors to approach timing strategies with appropriate caution and realistic expectations.
Success with market timing indicators depends more on disciplined implementation and risk management than on finding the perfect predictive tool. As markets continue to evolve, the most effective timing strategies will likely combine multiple indicators, maintain flexibility across different market regimes, and focus on risk-adjusted returns rather than absolute performance.
For your reference, recently published articles include:
-
-
- Why Investment Portfolio Monitoring Saves You Money
- Investment Banking Case Studies – Advice From The Best
- Investment Liquidity Analysis Made Simple – Three Free Samples
- How To Use Risk Tolerance Questionnaire Example For Better Results
- Master Your Wealth: Financial Disclaimers Explained
- Rate Volume Analysis: Best Expert Advice For Your Success
-
………………………………………………..
Important Notice: The information in this article is for general and public information purposes only. It solely reflects Didi Somm’s or his Staff’s opinion, and no responsibility can be assumed for errors or omissions in the service’s contents. For details, please read the Disclaimer at the bottom of the homepage.

