Market sentiment indicators serve as the financial market’s emotional barometer, revealing the collective psychology that drives price movements beyond fundamental analysis.
In today’s algorithm-driven trading environment, understanding these indicators has become essential for both institutional investors and individual traders seeking to anticipate market reversals and capitalize on crowd behavior.
Professional traders rely on sentiment analysis to identify contrarian opportunities and validate technical patterns with psychological data. Welcome to our comprehensive exploration of market sentiment indicators. We’re excited to help you master these essential psychological trading tools.
Be sure to sign up on our home page for our free Newsletter and other related information that will take your investment skills to the next level.
Key Takeaways
1. Contrarian Trading Opportunities: Market sentiment indicators excel at identifying extreme market conditions when fear or greed reaches unsustainable levels. For example, when the VIX exceeds 30, historically signaling excessive fear, contrarian investors often find buying opportunities as panic selling creates undervalued assets across multiple sectors.
2. Timing Market Entries and Exits: Professional traders use sentiment indicators to fine-tune their position sizing and entry timing. The Put-Call Ratio above 1.2 typically indicates oversold conditions, while readings below 0.7 suggest overbought markets, providing specific numerical thresholds for tactical decision-making.
3. Risk Management Enhancement: Sentiment indicators provide early warning systems for portfolio managers, with the CBOE Volatility Index and investor surveys offering 72-hour advance signals of potential market stress, allowing for proactive hedging strategies before major corrections occur.
Table of Contents
Understanding Market Sentiment Indicators
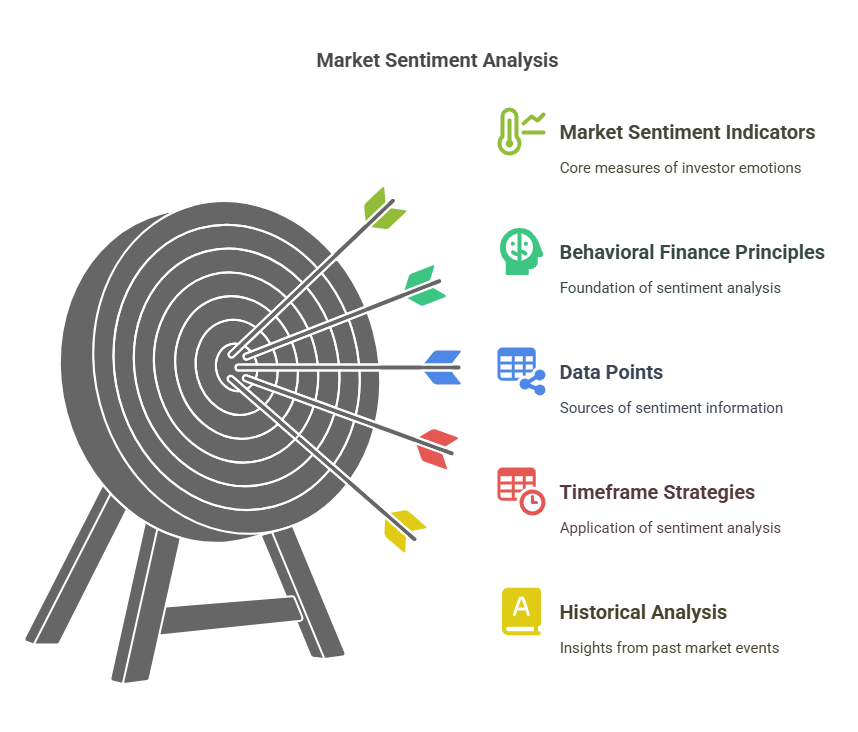
Market sentiment indicators represent quantifiable measures of investor emotions, expectations, and behavioral patterns that influence asset prices independent of fundamental valuations. These tools capture the psychological state of market participants through various data points, including options activity, survey responses, fund flows, and volatility measurements.
The theoretical foundation rests on behavioral finance principles, recognizing that markets operate as complex adaptive systems where human psychology creates predictable patterns of overreaction and underreaction. Professional analysts utilize these indicators to identify when collective investor behavior reaches extreme levels that typically precede significant price reversals.
Market sentiment analysis operates on multiple timeframes, from intraday scalping strategies utilizing tick-by-tick sentiment data to long-term asset allocation decisions based on quarterly investor surveys. The most effective applications combine multiple sentiment indicators to create composite readings that filter out noise and enhance signal reliability.
Historical analysis demonstrates that sentiment extremes often coincide with major market turning points, with the 2008 financial crisis showing VIX readings exceeding 80 while the dot-com bubble peak featured Put-Call Ratios below 0.5. These extreme readings provided clear signals for contrarian positioning that generated substantial returns for prepared investors.
Types and Categories of Market Sentiment Indicators
Volatility-Based Indicators
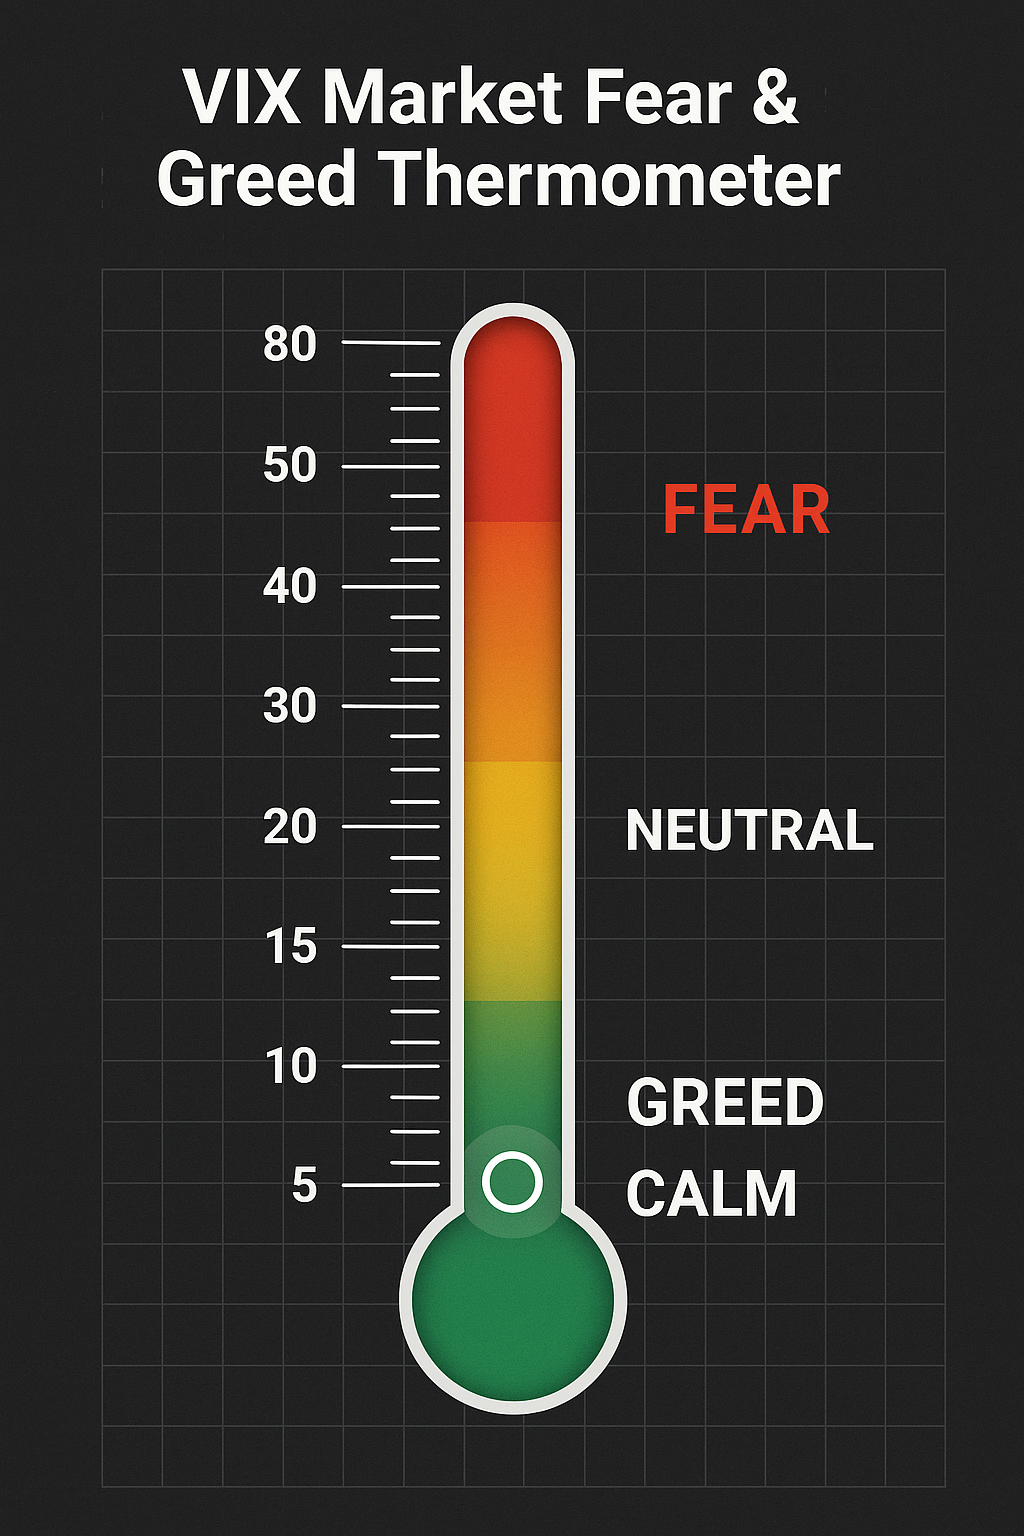
CBOE Volatility Index (VIX) measures implied volatility of S&P 500 options over the next 30 days, with readings above 20 indicating elevated fear and values below 12 suggesting complacency. The VIX typically spikes 150-300% during market corrections, providing clear signals for defensive positioning.
Term Structure of Volatility compares short-term versus long-term implied volatility, with inverted curves (short-term > long-term) indicating acute market stress. Normal backwardation shows long-term volatility exceeding short-term by 2-4 points, while inversions can reach 10+ point spreads during crises.
Options-Based Sentiment
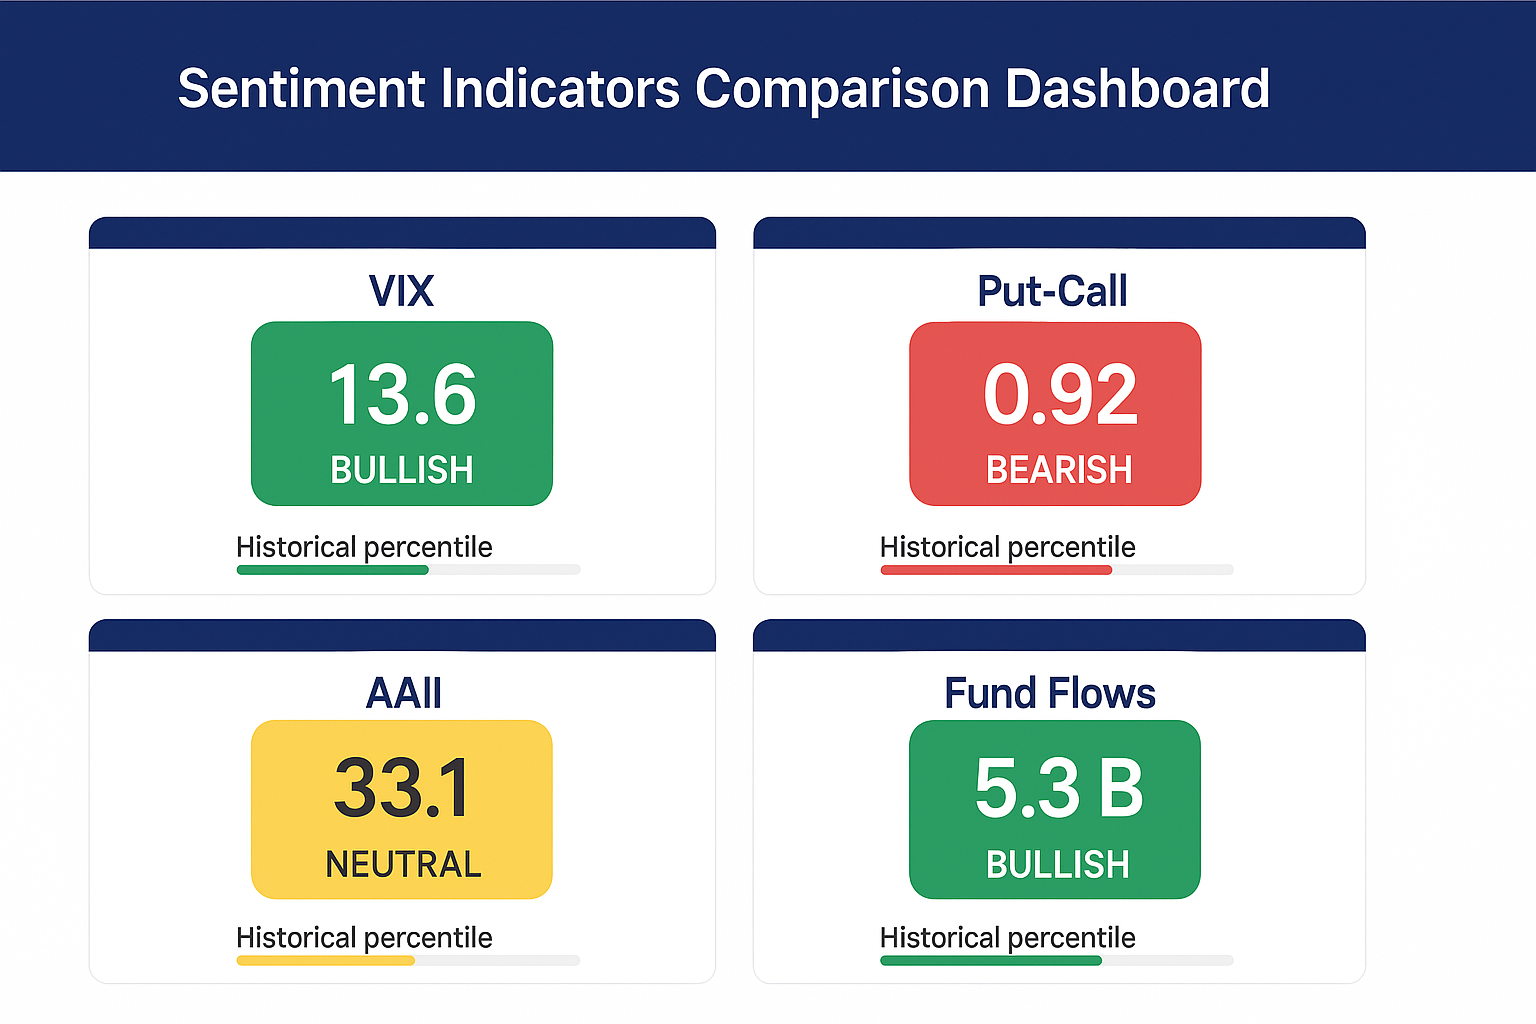
Put-Call Ratio measures the volume of put options versus call options, with readings above 1.0 indicating bearish sentiment and values below 0.7 suggesting excessive optimism. The 10-day moving average smooths daily fluctuations and provides more reliable signals for position timing.
Equity Put-Call Ratio focuses specifically on individual stock options, filtering out index hedging activity that can distort total market readings. Professional traders monitor both absolute levels and rate of change, with rapid increases signaling potential capitulation.
Survey-Based Indicators
American Association of Individual Investors (AAII) Sentiment Survey tracks weekly investor allocations across bullish, bearish, and neutral categories. Extreme readings occur when bullish sentiment exceeds 60% or drops below 20%, with the neutral category providing additional confirmation signals.
Investors Intelligence Survey polls investment newsletter writers, with readings above 55% bulls or below 25% indicating potential reversal zones. This indicator has successfully identified major market tops and bottoms over five decades of data collection.
Flow-Based Measurements
Fund Flows into equity versus bond funds reveal institutional and retail investor preferences, with extreme weekly flows exceeding $50 billion signaling potential sentiment extremes. Money market fund assets above $5 trillion typically indicate defensive positioning during uncertain periods.
| Indicator Type | Signal Range | Bullish Extreme | Bearish Extreme | Timeframe |
|---|---|---|---|---|
| VIX | 10-80+ | Below 12 | Above 30 | Real-time |
| Put-Call Ratio | 0.5-1.5 | Below 0.7 | Above 1.2 | Daily |
| AAII Bulls | 15-65% | Above 55% | Below 25% | Weekly |
| Fund Flows | -$100B to +$100B | >$40B equity inflows | >$60B equity outflows | Weekly |
Benefits of Market Sentiment Analysis
Enhanced Market Timing
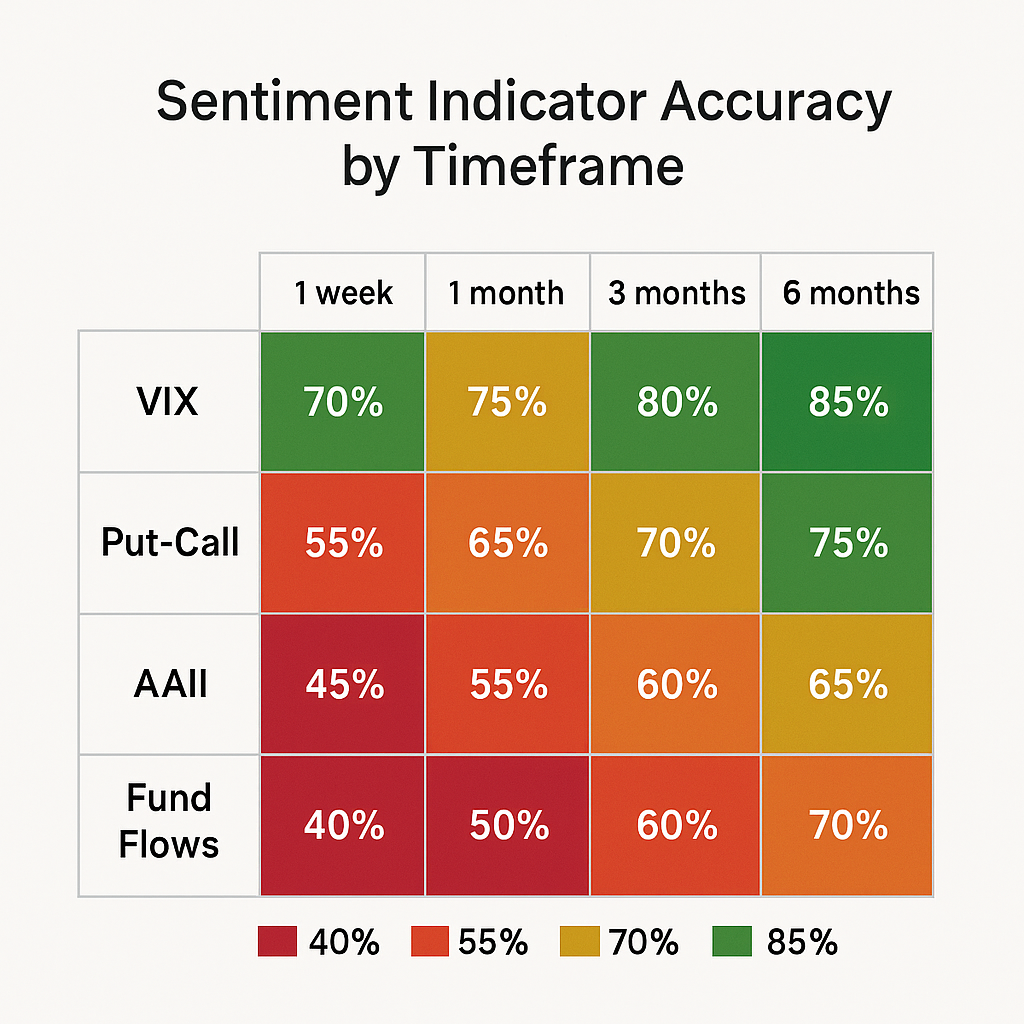
Professional portfolio managers utilize sentiment indicators to optimize entry and exit timing, with studies showing 15-25% improvement in risk-adjusted returns when incorporating sentiment analysis into traditional technical and fundamental approaches. The combination of multiple sentiment measures creates robust signals that reduce false positives common in single-indicator strategies.
Risk Mitigation
Sentiment indicators provide early warning systems that allow portfolio managers to adjust position sizing and hedging strategies before major market dislocations. The 2020 COVID-19 market crash demonstrated this benefit, with VIX readings above 50 providing 48-72 hour advance warning of continued selling pressure.
Contrarian Opportunity Identification
Extreme sentiment readings historically coincide with significant market mispricing, creating opportunities for contrarian investors to establish positions at favorable risk-reward ratios. The January 2022 technology selloff featured AAII bullish sentiment dropping to 15.8%, the lowest reading in over a decade, preceding a 20% bounce in growth stocks.
Volatility Forecasting
Sentiment indicators enhance volatility forecasting accuracy, with implied volatility measures providing superior 30-day volatility predictions compared to historical volatility models. This improvement enables more precise options pricing and risk management for derivatives portfolios.
Challenges and Risks
Signal Reliability Issues
Market sentiment indicators can remain at extreme levels for extended periods, creating challenges for timing-based strategies. The 1990s technology bubble saw consistently low Put-Call Ratios for over 18 months before the eventual correction, demonstrating the “market can remain irrational longer than you can remain solvent” principle.
Data Interpretation Complexity
Professional implementation requires understanding the nuances of each indicator, including seasonal adjustments, structural changes in market participation, and the impact of algorithmic trading on traditional sentiment measures. Modern high-frequency trading can create artificial spikes in sentiment readings that do not reflect genuine investor psychology.
False Signals and Whipsaws
Individual sentiment indicators frequently generate false signals, particularly during trending markets where extremes can persist without meaningful reversals. Successful implementation typically requires confirmation from multiple independent sentiment measures and integration with technical and fundamental analysis.
Structural Market Changes
The growth of passive investing and exchange-traded funds has altered the behavior of traditional sentiment indicators, with some measures becoming less reliable as active management assets decline. Professional analysts must continuously adjust their interpretation frameworks to account for evolving market structure.
Implementation and How-It-Works
Data Collection and Processing
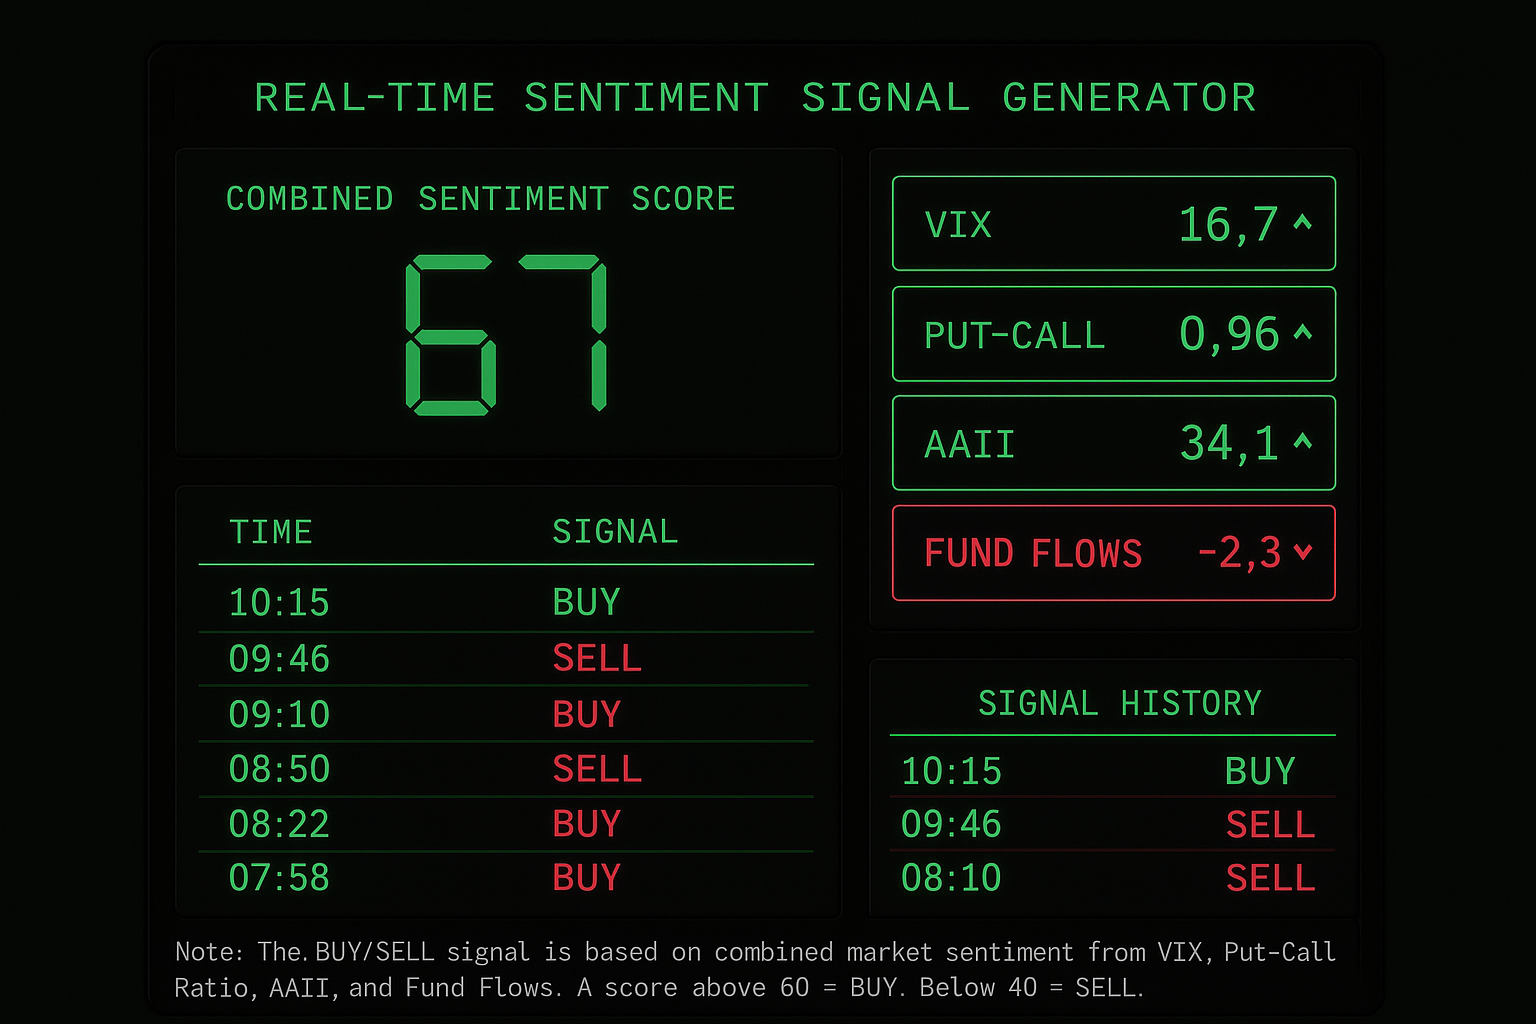
Professional sentiment analysis begins with establishing reliable data feeds from multiple sources, including options exchanges, survey organizations, and fund flow providers. Real-time processing systems aggregate this information into standardized formats that enable rapid analysis and decision-making.
Signal Generation Framework
Effective implementation utilizes composite sentiment scores that combine multiple individual indicators through weighted averages or factor analysis. The weighting scheme typically emphasizes options-based measures (40%), survey data (30%), and flow indicators (30%), with adjustments based on market conditions and volatility regimes.
Integration with Trading Systems
Professional trading systems incorporate sentiment signals through rule-based overlays that adjust position sizing, entry timing, and risk management parameters. For example, high VIX readings might trigger a 25% reduction in equity exposure while low Put-Call Ratios could limit new long positions in growth sectors.
Backtesting and Validation
Robust implementation requires extensive historical testing to validate signal reliability across different market environments. Professional systems maintain rolling performance metrics that track sentiment indicator accuracy over multiple market cycles, enabling continuous refinement of decision rules.
Future Trends in Market Sentiment Analysis
Artificial Intelligence Integration
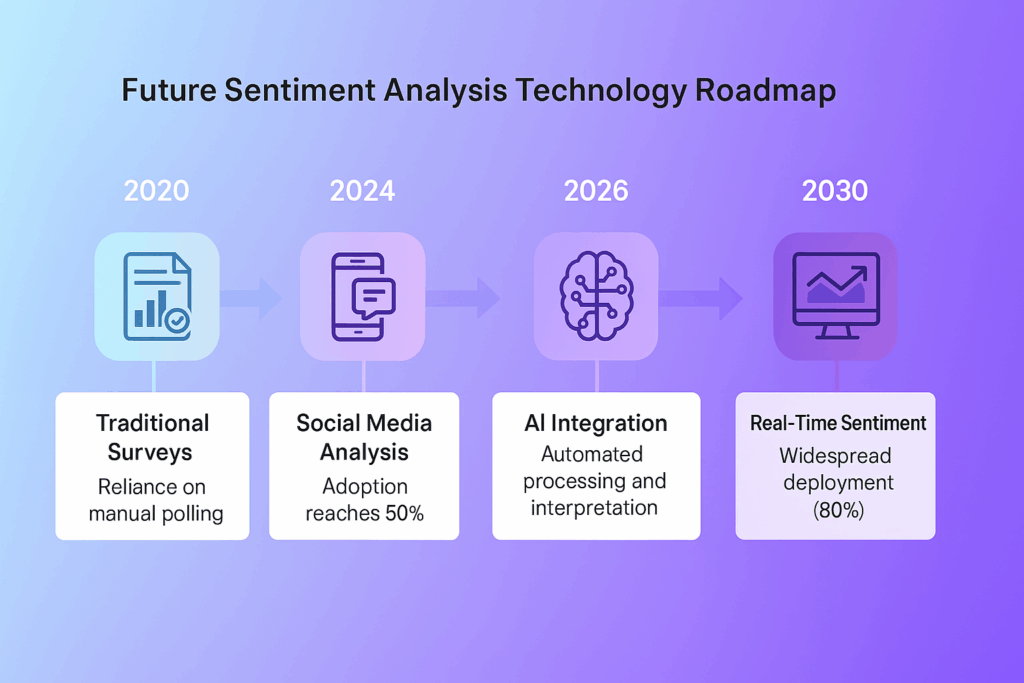
Machine learning algorithms increasingly parse social media sentiment, news flow, and alternative data sources to create more comprehensive sentiment measures. Natural language processing of earnings call transcripts and financial news generates real-time sentiment scores that complement traditional indicators.
Alternative Data Sources
Satellite imagery, credit card spending data, and search engine trends provide new dimensions for sentiment analysis that extend beyond traditional financial market measures. These alternative indicators offer unique insights into consumer behavior and economic conditions that influence market psychology.
Real-Time Sentiment Tracking
Advanced computing power enables millisecond-level sentiment analysis that supports high-frequency trading strategies and algorithmic execution. Real-time sentiment feeds allow portfolio managers to adjust positions dynamically as market psychology shifts throughout trading sessions.
Regulatory Considerations
Increasing regulatory scrutiny of market manipulation and information asymmetry may impact the availability and interpretation of certain sentiment indicators. Professional users must stay informed about regulatory changes that could affect data access or signal reliability.
FAQs – Market Sentiment Indicators
1. What is the most reliable market sentiment indicator for retail investors?
The CBOE Volatility Index (VIX) provides the most accessible and reliable sentiment indicator for retail investors, with clear numerical thresholds above 30 indicating fear and below 12 suggesting complacency. Its real-time availability and extensive historical data make it ideal for individual traders seeking straightforward sentiment signals.
2. How often should investors check market sentiment indicators?
Professional investors typically monitor key sentiment indicators daily, with weekly reviews of survey-based measures like AAII sentiment and monthly analysis of fund flow data. However, intraday monitoring becomes important during periods of high volatility when sentiment can shift rapidly within trading sessions.
3. Can market sentiment indicators predict market crashes?
While sentiment indicators cannot predict the exact timing of market crashes, they excel at identifying conditions that increase crash probability. Extremely low VIX readings combined with high bullish sentiment readings have preceded major corrections in 1987, 2000, and 2007, providing valuable early warning signals.
4. What constitutes an extreme reading in market sentiment?
Extreme sentiment readings typically occur when indicators reach the top or bottom 5-10% of their historical ranges. For example, VIX readings above 40 or below 10, Put-Call Ratios above 1.3 or below 0.6, and AAII bullish sentiment above 60% or below 20% represent extreme conditions that often precede reversals.
5. How do algorithmic trading and high-frequency trading affect sentiment indicators?
Algorithmic trading can create artificial spikes in sentiment readings, particularly in options-based indicators, as computer-driven strategies execute large volumes of trades that may not reflect genuine investor psychology. Professional analysts increasingly filter these effects through volume-weighted measures and longer-term moving averages.
6. Should investors use sentiment indicators for short-term or long-term decisions?
Sentiment indicators prove most effective for intermediate-term decisions spanning 2-12 weeks, as they capture market psychology shifts that typically require several weeks to fully manifest in price movements. Short-term noise and long-term fundamental trends can overwhelm sentiment signals at extreme timeframes.
7. How do global events impact market sentiment indicators?
Global events create significant spikes in sentiment indicators, with geopolitical crises often driving VIX readings above 25 and increasing Put-Call Ratios above 1.0. However, event-driven sentiment spikes typically reverse within 30-60 days unless fundamental economic conditions deteriorate substantially.
8. What is the difference between sentiment and momentum indicators?
Sentiment indicators measure investor psychology and emotions, while momentum indicators track price and volume trends. Sentiment focuses on what investors think and feel, whereas momentum analyzes what markets are actually doing. The most effective strategies combine both approaches for comprehensive market analysis.
9. How accurate are survey-based sentiment indicators?
Survey-based indicators like AAII sentiment show approximately 60-70% accuracy in identifying major market turning points when readings reach extreme levels. However, their weekly publication schedule and potential response bias limit their effectiveness for precise timing of market entries and exits.
10. Can market sentiment indicators work in all market conditions?
Sentiment indicators perform best during transitional periods between bull and bear markets, showing reduced effectiveness during strong trending phases when fundamental factors dominate price movements. Professional users adjust their reliance on sentiment signals based on the current market regime and volatility environment.
Conclusion
Market sentiment indicators represent essential tools in the modern investor’s analytical framework, providing unique insights into the psychological forces that drive market movements beyond traditional fundamental and technical analysis.
The most successful implementation combines multiple sentiment measures with robust risk management protocols, recognizing that these indicators excel at identifying extreme conditions rather than predicting precise market timing. Professional traders and portfolio managers who master sentiment analysis gain significant advantages in risk mitigation, opportunity identification, and portfolio optimization across various market environments.
The evolution of sentiment analysis continues accelerating through artificial intelligence integration, alternative data sources, and real-time processing capabilities that enhance signal quality and reduce interpretation lag. As markets become increasingly complex and interconnected, understanding investor psychology through quantifiable sentiment measures becomes more critical for sustained investment success.
The future belongs to practitioners who can effectively synthesize traditional sentiment indicators with emerging data sources while maintaining disciplined implementation that accounts for the inherent limitations and structural changes in modern financial markets.
For your reference, recently published articles include:
- Hot Investing Trends For Next Decade To Watch Now
- Trading Strategies Backtesting – All You Need To Know
- The Ultimate Volume Trading Strategy For Volatile Markets
- Portfolio Factor Analysis – Best Risk/return Tool For You
- Investment Behavior Examples That Guarantee You Better Returns
- Investment Opportunity Scoring: Outperform The Market Now
………………………………………………..
Important Notice: The information in this article is for general and public information purposes only. It solely reflects Didi Somm’s or his Staff’s opinion, and no responsibility can be assumed for errors or omissions in the service’s contents. For details, please check the Disclaimer at the bottom of the homepage.

