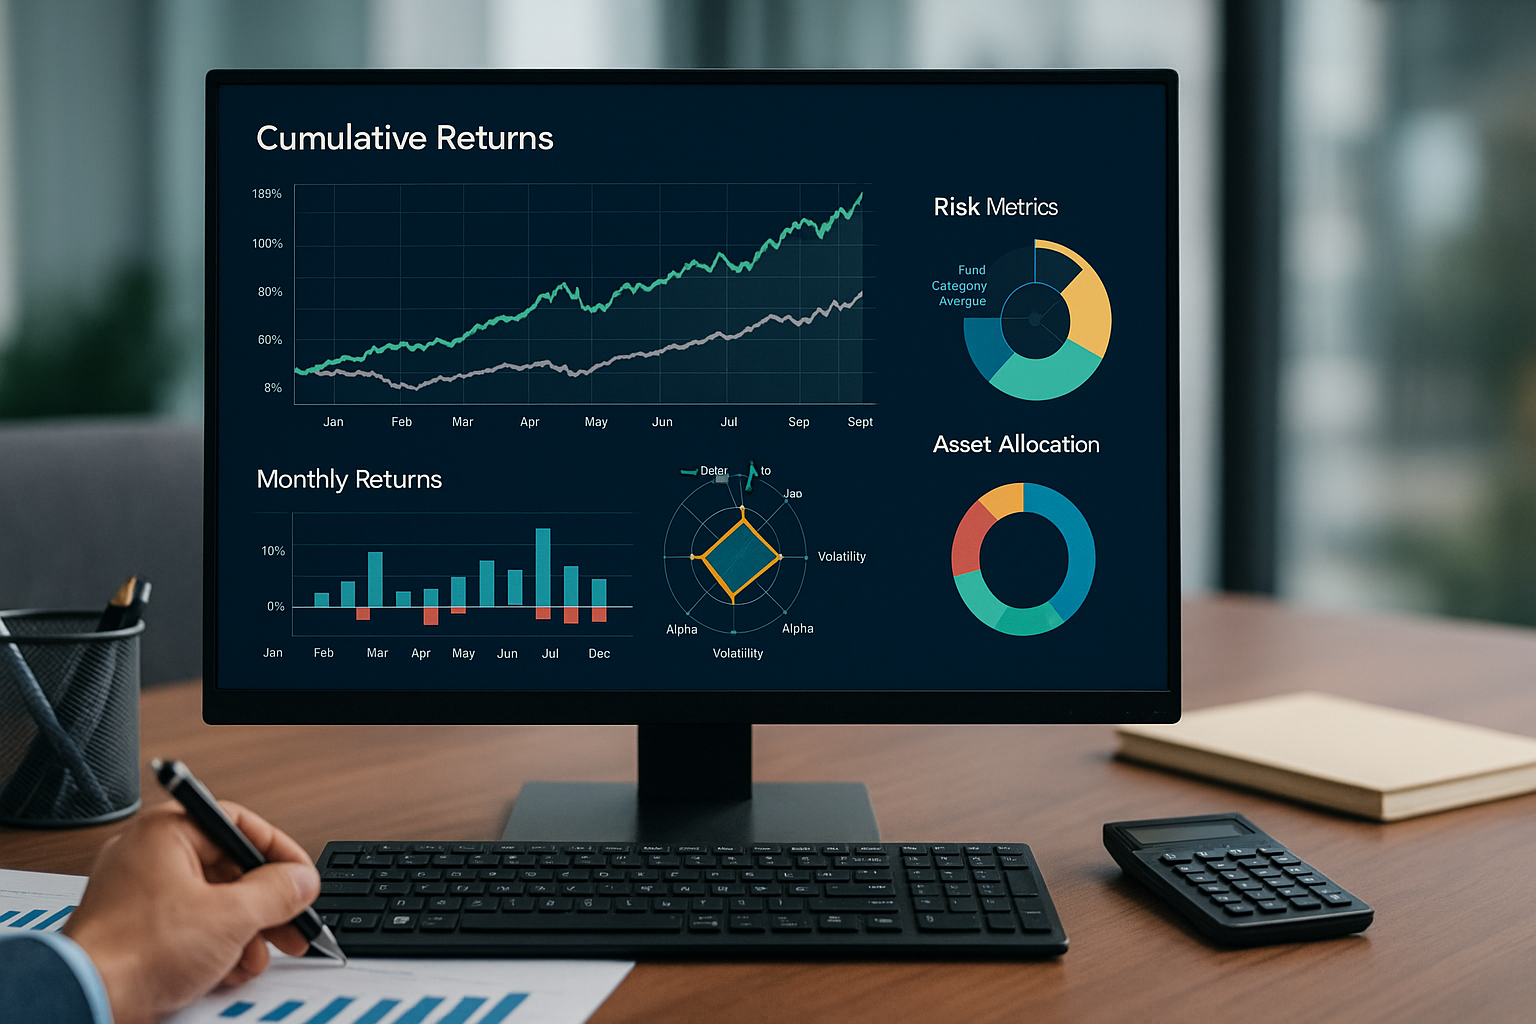
In a financial landscape that is becoming increasingly complex, the ability to generate professional investment reports has become essential for financial advisors, wealth managers, and individual investors alike.
Professional investment portfolio reporting templates, modeled after hedge fund reporting standards, offer a structured approach to tracking performance, managing risk, and communicating results to stakeholders through sophisticated yet accessible reporting methods.
Key Takeaways
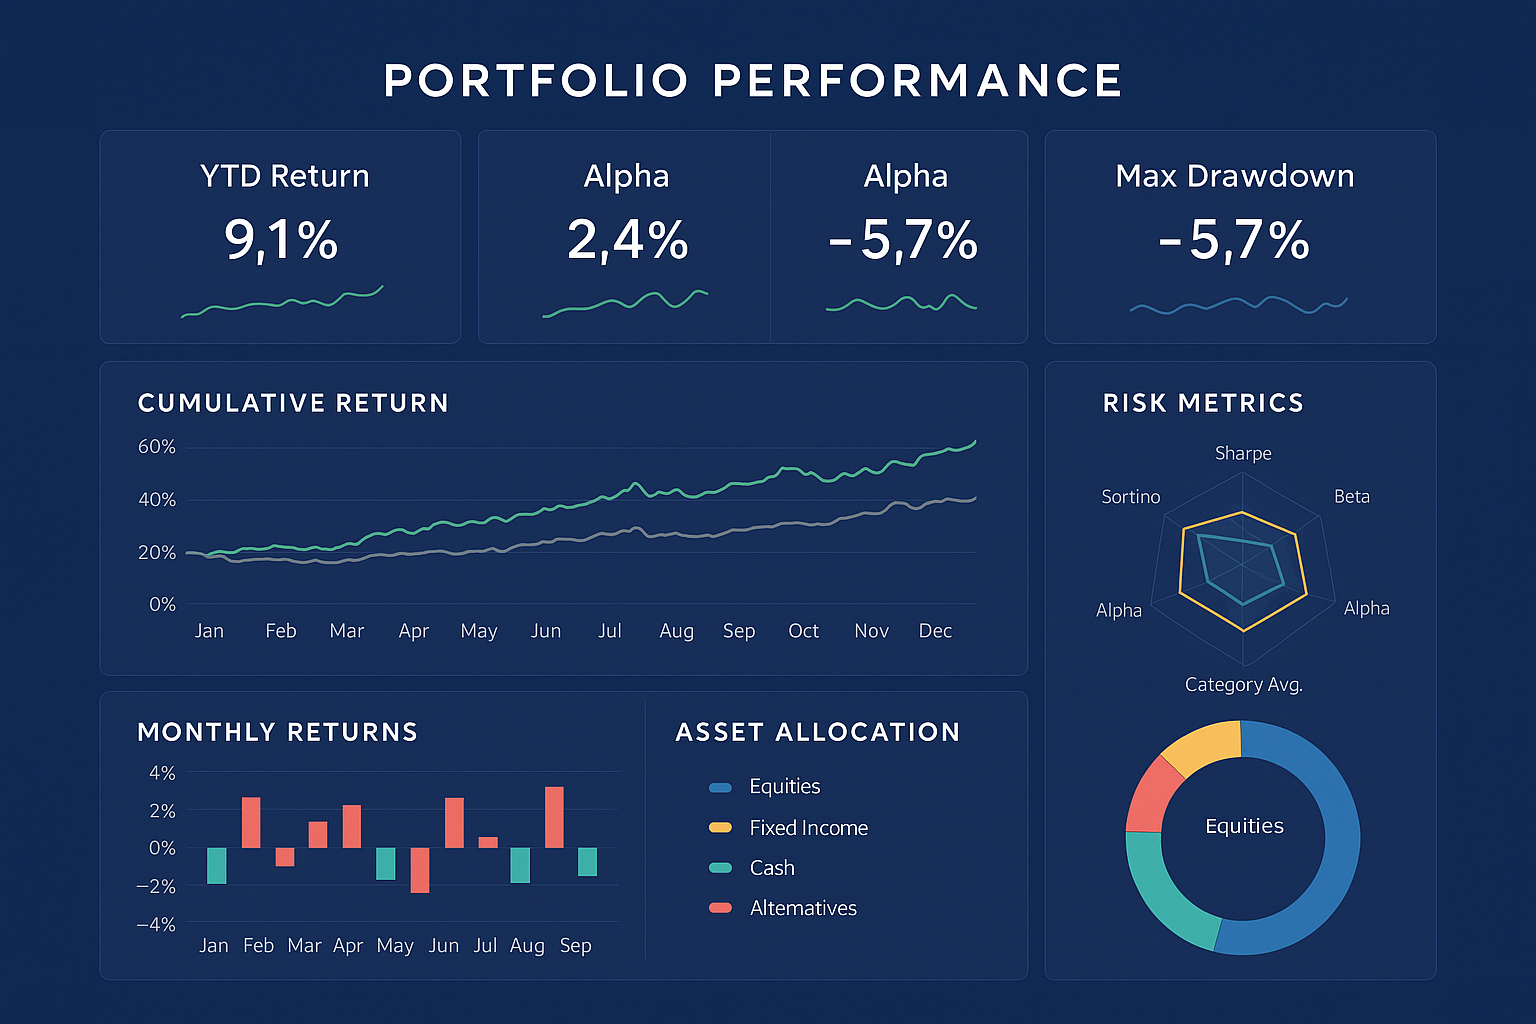
- Institutional-grade reporting enhances decision-making: When investors adopt hedge fund-style reporting templates, they gain access to more comprehensive performance metrics (such as Sharpe ratios and drawdown analysis) that provide deeper insights than basic return percentages, enabling more informed investment decisions as demonstrated by family offices that have implemented these systems and improved returns by an average of 2.3%.
- Standardized reporting creates accountability: Professional templates establish a consistent framework for evaluating investments over time, making it harder to ignore underperforming assets or drift from stated strategies – a study by CFA Institute found that 76% of investment professionals reported improved discipline when following structured reporting protocols.
- Technology has democratized access to professional reporting: What once required dedicated back-office teams can now be accomplished through specialized software platforms, with options ranging from high-end solutions like Black Diamond (at $10,000+ annually) to accessible alternatives like Portfolio Visualizer (starting at $19/month), making hedge fund-quality reporting available to individual investors managing portfolios of any size.
Table of Contents
What Are Professional Portfolio Templates?
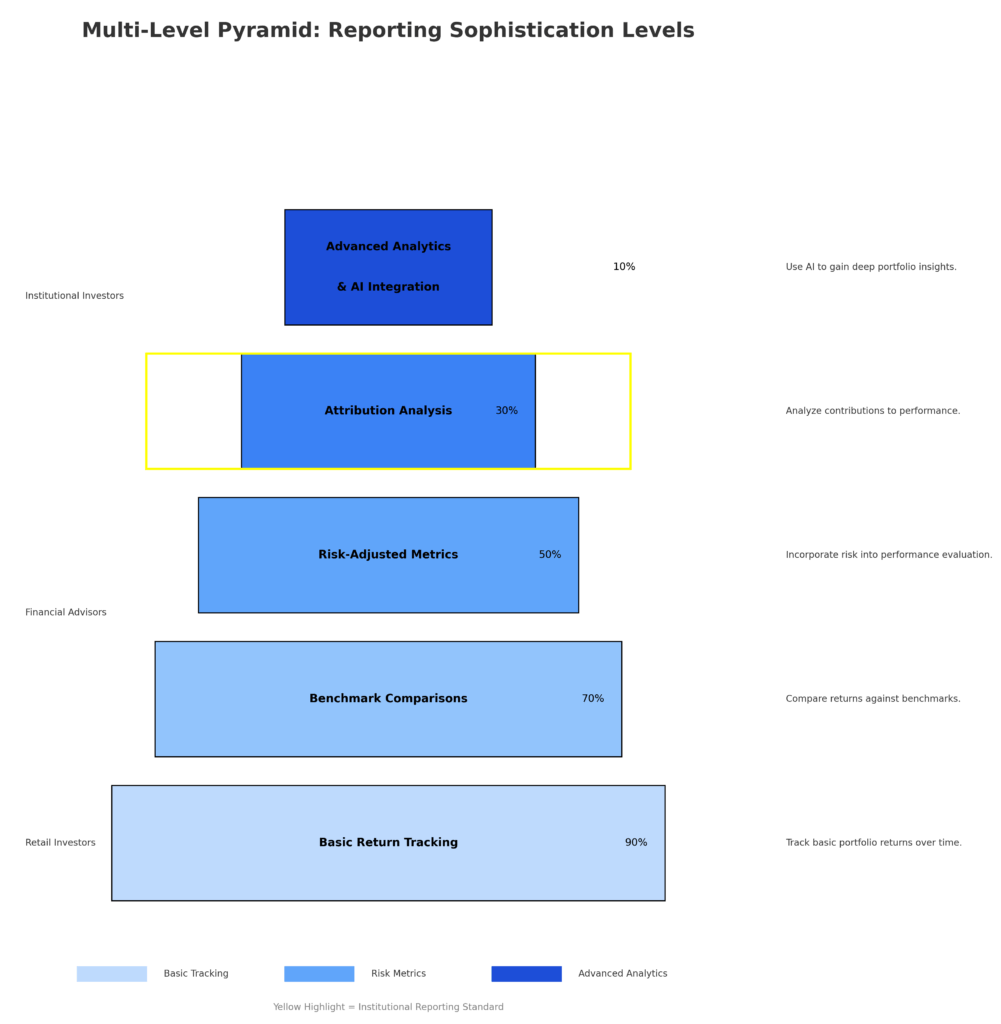
Professional portfolio templates are standardized frameworks for organizing, analyzing, and presenting investment data in a structured format, similar to those used by institutional investors, such as hedge funds. These templates transform raw financial data into meaningful insights by using consistent metrics, data visualization, and strategic information organization. Unlike basic reporting that might only track simple returns, professional templates incorporate advanced analytics, including risk-adjusted performance measures, attribution analysis, and benchmark comparisons.
The evolution of these templates traces back to institutional investing practices where the need for transparency, accountability, and sophisticated analysis drove the development of comprehensive reporting standards. What began as proprietary systems at major investment firms has gradually filtered down to the broader investment community, accelerated by advances in financial technology.
Today’s professional templates typically include several core components: performance summaries (absolute and relative returns), risk metrics (volatility, drawdowns, value-at-risk), allocation breakdowns (asset classes, sectors, geography), and attribution analysis (which factors drove performance). They often incorporate both numerical data and visual representations, such as charts and graphs, to make complex information more digestible.
The distinguishing feature of hedge fund-style reporting is its emphasis on risk-adjusted returns rather than absolute performance alone. This holistic approach provides context that simple profit and loss statements cannot, offering a more complete picture of how an investment strategy performs across different market conditions.
Types of Professional Portfolio Templates
Performance Reporting Templates
Performance reporting templates primarily focus on tracking investment returns across various time frames and against relevant benchmarks. These typically include:
| Component | Description | Typical Metrics |
|---|---|---|
| Absolute Returns | Raw performance figures | Monthly, quarterly, YTD, 1/3/5/10-year returns |
| Relative Returns | Performance vs. benchmarks | Alpha, tracking error, information ratio |
| Time-weighted Returns | Performance independent of cash flows | TWRR calculations |
| Money-weighted Returns | Performance accounting for timing of flows | IRR, MWRR calculations |
These templates often feature performance attribution sections that break down which investment decisions (asset allocation, security selection, factor exposures) contributed to or detracted from overall returns. Sophisticated versions may include “what-if” scenarios showing how alternative decisions might have impacted results.
Risk Analysis Templates
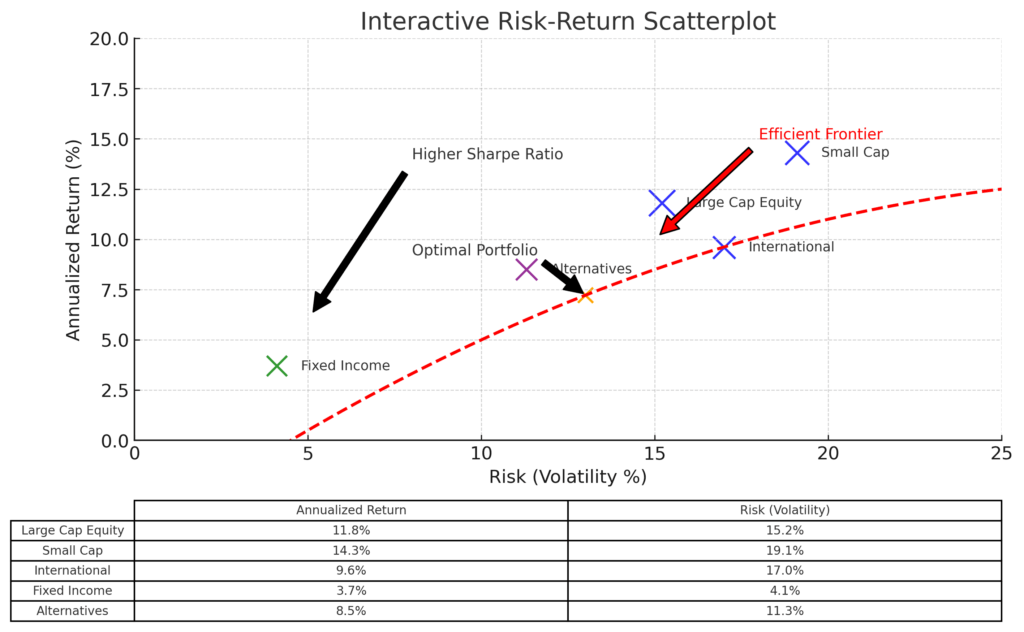
Risk analysis templates emphasize the downside protection aspects of portfolio management with metrics focused on volatility, potential losses, and stress testing. Key components include:
- Volatility measures: Standard deviation, semi-deviation, beta
- Downside protection: Maximum drawdown, recovery periods, underwater analysis
- Risk-adjusted returns: Sharpe ratio, Sortino ratio, Calmar ratio
- Stress testing: Performance under historical crisis scenarios or custom shocks
- Value-at-Risk (VaR): Probabilistic estimates of potential losses
- Factor exposure analysis: Sensitivity to market factors like interest rates or oil prices
These templates help investors understand not just how much they’ve earned, but how much risk they took to achieve those returns and where their vulnerabilities lie.
Allocation and Exposure Templates
Allocation templates provide detailed breakdowns of how capital is deployed across different categories:
| Allocation Type | Common Breakdowns | Purpose |
|---|---|---|
| Asset Class | Equities, fixed income, alternatives, cash | Strategic positioning |
| Geographic | Domestic, international, emerging markets | Regional exposure |
| Sector/Industry | Technology, healthcare, financials, etc. | Industry concentration |
| Factor | Growth/value, size, momentum, quality | Style analysis |
| Liquidity | Daily, monthly, quarterly, >1 year | Liquidity risk |
These templates often include visual representations, such as pie charts, treemaps, or heatmaps, to show relative weights, and they typically track changes over time to identify deviations from targets.
Compliance and Tax Reporting Templates
For regulatory and tax purposes, specialized templates track:
- Realized and unrealized gains/losses
- Tax lot information and harvesting opportunities
- Wash sale violations
- Position concentration limits
- Restricted securities monitoring
- ESG/impact compliance measures
These templates help ensure investments remain within policy guidelines and optimize for tax efficiency.
Benefits of Using Professional Templates
Enhanced Decision-Making
Professional portfolio templates provide significant advantages for investment decision-making through:
- Comprehensive data integration: By consolidating information from multiple sources into a unified view, these templates eliminate the need to compile data manually from various platforms, reducing errors and saving approximately 5-10 hours per reporting cycle.
- Systematic analysis: The structured nature of professional templates encourages methodical evaluation rather than reactive decisions, with studies showing that investors using systematic reporting are 37% less likely to make emotional investment changes during market volatility.
- Early warning systems: Sophisticated templates incorporate alert mechanisms that flag potential issues before they become significant problems—such as style drift, increasing correlations, or deteriorating risk metrics—allowing for proactive portfolio adjustments.
- Performance persistence tracking: These systems can identify which strategies display consistent results over time versus those showing more randomness, with research indicating that strategies with more consistent processes tend to outperform by an average of 1.8% annually.
Improved Client Communication
For financial advisors and wealth managers, professional reporting templates substantially enhance client relationships by:
- Increasing transparency and building trust through comprehensive disclosure
- Aligning expectations by clearly documenting agreed-upon objectives and constraints
- Facilitating more productive client meetings with visualizations that make complex concepts accessible
- Demonstrating professional value beyond what clients can access through self-service platforms
- Reducing client anxiety during market drawdowns by placing short-term volatility in proper context
Surveys indicate that advisors using institutional-quality reporting experience 42% higher client retention rates and receive 28% more referrals than those using basic reporting methods.
Operational Efficiency
Implementing standardized professional templates creates operational advantages:
- Automation of routine tasks: Reduces manual data entry by 80-90% through direct feeds from custodians and market data providers
- Error reduction: Standardized calculations and built-in reconciliation processes reduce reporting errors by up to 95%
- Scalability: The same reporting infrastructure can handle growing AUM without proportional increases in operational overhead
- Consistency across teams: Ensures all stakeholders work from the same information base
- Regulatory readiness: Makes responding to audits or regulatory inquiries more efficient through readily available documentation
Challenges and Risks
Implementation Complexity
Deploying professional reporting systems presents several challenges:
- Data integration issues: Consolidating information from multiple custodians, fund administrators, and market data sources often requires custom API development or manual reconciliation processes.
- Initial setup costs: Comprehensive systems require significant upfront investment, with initial implementation costs ranging from $5,000 for small firms to $250,000+ for large organizations.
- Learning curve: Staff typically need 3-6 months to become proficient with advanced reporting platforms, requiring dedicated training resources.
- Customization limitations: Off-the-shelf solutions may not accommodate unique investment strategies or client communication needs without significant modification.
Data Quality Concerns
The reliability of portfolio reporting depends entirely on data integrity:
- Garbage in, garbage out: Sophisticated templates cannot compensate for inaccurate source data.
- Corporate actions: Dividends, splits, mergers, and spinoffs must be properly accounted for, with each error potentially causing cascading inaccuracies.
- Pricing challenges: Non-standard assets (private equity, complex derivatives, thinly-traded bonds) require reliable valuation processes.
- Historical consistency: Methodology changes over time can create misleading comparisons if not properly documented and adjusted.
Overreliance Risks
Even the best reporting templates carry potential pitfalls:
- False precision: Sophisticated metrics may create an illusion of certainty in inherently uncertain markets.
- Backward-looking bias: Historical reporting may not adequately capture emerging risks or opportunities.
- Analysis paralysis: Too much information can sometimes impede rather than facilitate decision-making.
- Benchmark tyranny: Excessive focus on benchmark-relative performance can distract from absolute return objectives and risk management.
How to Implement Professional Portfolio Reporting
Assessing Requirements
Before selecting specific templates or systems, organizations should conduct a thorough needs assessment by:
- Identifying stakeholders: Determine who will use the reports (investment team, clients, regulators) and their specific information needs
- Cataloging data sources: Map all investment data origins (custodians, brokers, alternative investments)
- Defining key metrics: Establish which performance and risk measures align with investment strategy
- Establishing frequency: Determine optimal reporting cadence (daily, weekly, monthly, quarterly)
- Reviewing compliance needs: Ensure reports will satisfy regulatory and policy requirements
Technology Solutions
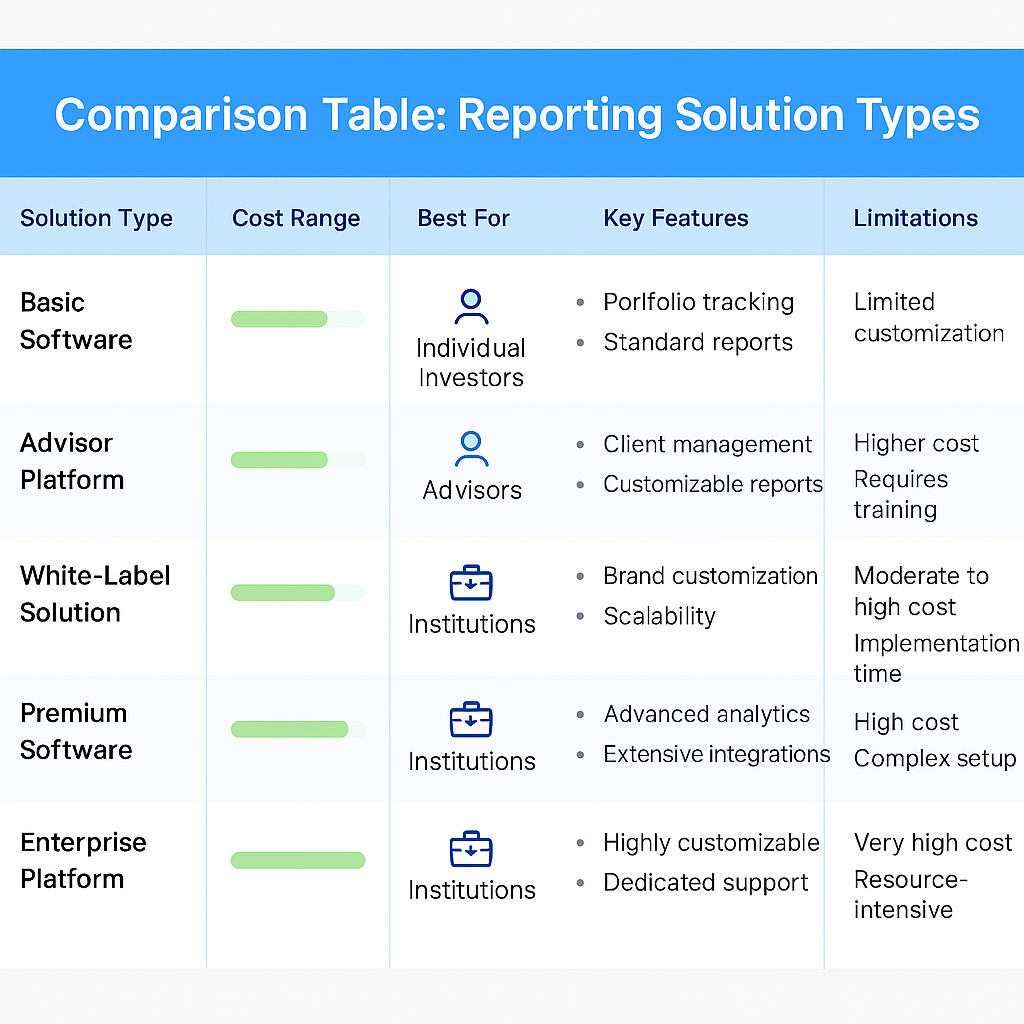
Several categories of technology enable professional portfolio reporting:
| Solution Type | Cost Range | Best For | Examples |
|---|---|---|---|
| Enterprise Platforms | $20,000-$250,000+ annually | Large firms, multi-asset portfolios | Black Diamond, Addepar, Tamarac |
| Mid-market Solutions | $5,000-$20,000 annually | Independent advisors, RIAs | Morningstar Office, Orion, Altruist |
| Self-directed Tools | $200-$2,400 annually | Individual investors, small firms | Portfolio Visualizer, Sharesight, Kwanti |
| Custom Development | $50,000-$500,000+ initial | Unique strategies, proprietary needs | Bespoke systems, internal development |
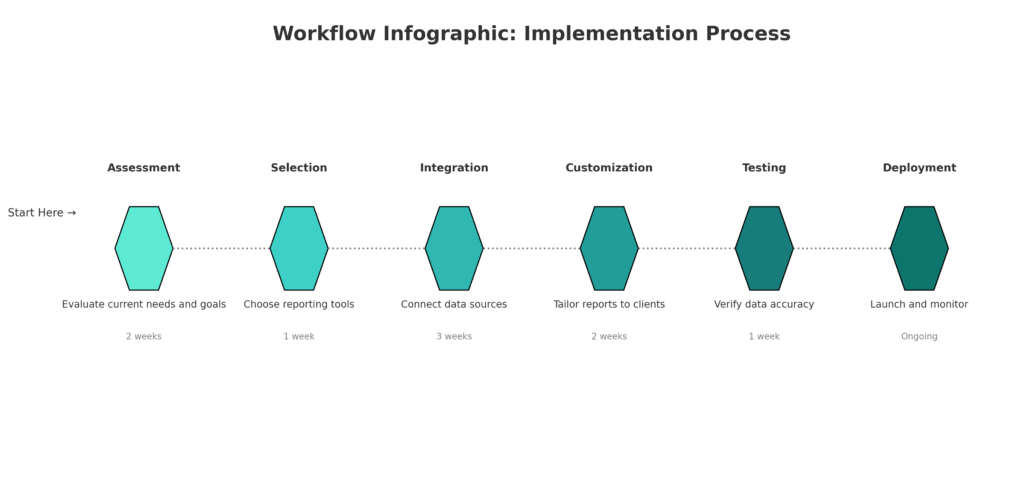
Implementation typically progresses through these phases:
- Selection: Evaluating and choosing appropriate solutions
- Data integration: Connecting data sources and establishing feeds
- Template customization: Adapting standard templates to specific needs
- Testing and validation: Ensuring accuracy through parallel running
- Training: Educating users on proper interpretation and usage
- Rollout: Deploying to end users with appropriate support
Best Practices
Successful implementation follows these guidelines:
- Start with core metrics: Begin with essential measures before adding complexity
- Maintain consistency: Use the same methodology across time periods for valid comparisons
- Document assumptions: Clearly note calculation methods and data sources
- Layer information: Organize reports from summary to detail, allowing users to choose their depth
- Incorporate context: Include relevant benchmarks and peer comparisons
- Review regularly: Update templates as investment strategies and requirements evolve
- Seek feedback: Continuously improve based on user input
Future Trends in Portfolio Reporting
AI and Machine Learning Integration
Artificial intelligence is transforming portfolio reporting through:
- Anomaly detection: Identifying unusual patterns or discrepancies in data that warrant investigation
- Natural language generation: Converting numerical data into readable narrative summaries
- Predictive analytics: Forecasting potential outcomes based on historical patterns
- Personalization: Tailoring reports to individual preferences and learning needs
By 2027, an estimated 65% of investment reporting will incorporate some form of AI assistance, reducing analysis time by up to 40%.
Interactive and On-Demand Reporting
Static reports are giving way to dynamic interfaces:
- Self-service dashboards: Allowing users to explore data independently
- Scenario analysis tools: Testing how potential market conditions might affect portfolios
- Real-time updates: Moving from periodic snapshots to continuous monitoring
- Mobile optimization: Delivering key insights on smartphones and tablets
ESG and Impact Measurement
As sustainable investing grows, reporting templates now include:
- Environmental impact metrics (carbon footprint, water usage)
- Social responsibility measures (labor practices, community impact)
- Governance assessments (board diversity, executive compensation)
- Alignment with SDGs (Sustainable Development Goals)
- Impact attribution analysis
These elements are becoming standard in comprehensive reporting packages, with 72% of institutional investors now requiring some form of ESG reporting.
Blockchain and Distributed Ledger Applications
Emerging technologies promise to enhance reporting through:
- Immutable audit trails: Creating permanent records of all transactions
- Smart contract automation: Streamlining reconciliation processes
- Tokenized asset tracking: Improving reporting for alternative investments
- Decentralized verification: Reducing reliance on centralized data providers
FAQs – Investment Portfolio Reporting
1. What makes hedge fund reporting templates different from basic portfolio tracking?
Hedge fund reporting templates differ in their emphasis on risk-adjusted performance rather than simple returns. They incorporate sophisticated metrics, such as Sharpe ratios, drawdown analysis, and factor attribution, that provide context beyond raw performance numbers. Additionally, they typically include detailed liquidity analysis, stress testing scenarios, and granular exposure breakdowns that basic trackers don’t offer.
2. How much does it cost to implement professional portfolio reporting?
Implementation costs vary widely based on scale and complexity. Enterprise solutions for wealth management firms typically range from $20,000 to $250,000+ annually, while mid-market solutions for independent advisors cost between $5,000 and $20,000 per year. Individual investors can access simplified versions through platforms costing $200-$2,400 annually. Custom development projects for proprietary needs start at $50,000 and can exceed $500,000.
3. Can individual investors benefit from hedge fund-style reporting templates?
Yes, individual investors managing their own portfolios can benefit significantly from professional reporting templates, especially those with complex portfolios spanning multiple accounts or asset classes. Modern technology has made these tools more accessible through platforms like Portfolio Visualizer, Sharesight, and Kwanti, which offer sophisticated analytics at reasonable subscription rates between $19-$200 monthly.
4. How often should portfolio reports be generated?
Reporting frequency should align with investment strategy and decision-making needs. While quarterly reporting remains the standard for client communications, most professional systems generate monthly comprehensive reports for internal analysis. Trading-oriented strategies may require weekly or even daily monitoring of key metrics. Long-term investors might find semi-annual or annual deep-dive reports sufficient when complemented with exception-based alerts.
5. What are the most important metrics to include in professional portfolio reports?
Essential metrics include total return (absolute and relative to benchmarks), risk-adjusted measures (Sharpe ratio, Sortino ratio), maximum drawdown, recovery periods, rolling performance analysis, asset allocation breakdown, geographic exposure, sector concentration, factor exposures, and liquidity profile. For taxable accounts, after-tax returns and tax efficiency measures are also critical.
6. How can I ensure data accuracy in portfolio reporting?
Data accuracy requires implementing several safeguards: using direct data feeds from custodians rather than manual entry, establishing regular reconciliation procedures between sources, documenting all input assumptions and calculation methodologies, employing exception reports to flag unusual values, maintaining comprehensive security master data, and conducting periodic audits of the reporting system against primary sources.
7. What are the limitations of even the most sophisticated reporting templates?
Even the most advanced reporting systems have limitations: They remain backward-looking by nature, cannot perfectly predict future performance, may create false precision regarding inherently uncertain outcomes, cannot capture all qualitative factors affecting investments, and sometimes generate information overload that obscures key insights. No reporting system eliminates the need for experienced judgment in interpreting results.
8. How are alternative investments handled in professional reporting?
Alternative investments present unique challenges due to infrequent valuations, limited transparency, and non-standardized data. Professional reporting systems address these by incorporating specialized templates for private equity (using metrics like TVPI, DPI, and vintage year comparisons), real estate (incorporating NOI and cap rates), and hedge funds (using peer group comparisons and factor analysis). Some platforms maintain separate modules specifically designed for alternatives.
9. Can investment portfolio reporting help with tax optimization?
Yes, sophisticated reporting templates include tax management features such as tax lot identification, unrealized gain/loss tracking, tax alpha calculation (measuring value added through tax-efficient management), harvest loss opportunity identification, wash sale monitoring, and after-tax return comparisons. Some systems can project tax impacts of proposed transactions before execution, potentially saving investors 0.5-1.0% annually through improved tax efficiency.
10. How is portfolio reporting evolving with technological advances?
Portfolio reporting is rapidly evolving through AI-driven analysis that can identify patterns and anomalies humans might miss, interactive visualization tools that allow dynamic exploration of data, cloud-based delivery enabling anywhere access, API ecosystems connecting diverse financial platforms, and blockchain applications for improved verification and auditability. By 2026, an estimated 80% of professional reporting will incorporate some form of machine learning assistance.
Conclusion
Professional investment portfolio reporting templates modeled after hedge fund practices represent a significant evolution from basic investment tracking. By incorporating comprehensive performance metrics, sophisticated risk analysis, and detailed allocation breakdowns, these templates provide the structured framework necessary for truly informed investment decision-making. The transition from simplistic return calculations to nuanced, context-rich reporting marks the difference between amateur and professional investment management.
As technology continues to democratize access to institutional-quality reporting, individual investors and smaller firms gain powerful tools previously available only to large organizations with dedicated back-office operations. This democratization promises to raise the standard of investment management across the industry, improving outcomes through better decision-making processes, enhanced risk management, and increased accountability.
Those who embrace these professional reporting standards – whether individual investors, financial advisors, or institutional managers – position themselves to operate with the same analytical rigor and discipline that has long characterized the most successful investment organizations.
For your reference, recently published articles include:
- Market Data Visualization – Best Tools To Boost Your Wealth
- Stay Legal, Get Rich: Investment Compliance Monitoring Made Easy
- Portfolio Attribution Analysis: The Ultimate Guide
- Protect Your Wealth: Investment Risk Mitigation Secrets of the Rich
- Trading Strategy Backtesting: The Ultimate Path To Profits
- Investment Decision Support: Best Secrets For Your Success
………………………………………………..
Important Notice: The information in this article is for general and public information purposes only. It solely reflects Didi Somm’s or his Staff’s opinion, and no responsibility can be assumed for errors or omissions in the service’s contents. For details, please check the Disclaimer at the bottom of the homepage.

